This function computes AUC scores for multiple gene signatures and scoring methods, and generates a heatmap for each gene signature. The heatmap displays the AUC scores, with the contrasts as rows and methods as columns. The heatmaps are then arranged in a grid layout.
Arguments
- data
A data frame of gene expression data with genes as rows and samples as columns. Row names should contain gene names and column names sample identifiers.
- metadata
A data frame of sample metadata. The first column must contain sample identifiers matching those in
data.- gene_sets
A named list of gene sets.
- method
A character string specifying the scoring method(s) (
"logmedian","ssGSEA","ranking", or"all").- mode
A string specifying the level of detail for contrasts. Options are:
"simple": Pairwise comparisons (e.g., A - B)."medium": Pairwise comparisons plus comparisons against the mean of other groups."extensive": All possible groupwise contrasts, ensuring balance in the number of terms on each side.
- variable
A string specifying the grouping variable in
metadataused for computing AUC comparisons.- nrow
Optional. An integer specifying the number of rows in the heatmap grid. If
NULL, the number of rows is computed automatically.- ncol
Optional. An integer specifying the number of columns in the heatmap grid. If
NULL, the number of columns is computed automatically.- limits
Optional. A numeric vector of length 2 specifying the color scale limits (e.g.,
c(min, max)). IfNULL, the limits are determined from the data.- widthTitle
An integer specifying the width used for wrapping gene set signature names in the heatmap titles. Default is 22.
- titlesize
An integer specifying the text size for each of the heatmap titles. Default is 12.
- ColorValues
A character vector specifying the colors for the gradient fill in the heatmaps. Default is
c("#F9F4AE", "#B44141").- title
Title for the grid of plots.
Value
A list with two elements:
- plt
A combined heatmap arranged in a grid using
ggpubr::ggarrange.- data
A list containing the AUC scores for each gene signature, as computed by
ROCAUC_Scores_Calculate.
Details
The function first calculates AUC scores for each gene signature
using ROCAUC_Scores_Calculate. The resulting matrices are converted
to a long format so that each cell in the heatmap can display the AUC
value. A title for each heatmap is dynamically created. The heatmaps are
then adjusted to display axis text and ticks only for the left-most column
and bottom row, and combined into a grid layout. If neither nrow nor
ncol are specified, the layout is automatically determined to best
approximate a square grid.
Examples
# Example data
data <- as.data.frame(abs(matrix(rnorm(1000), ncol = 10)))
rownames(data) <- paste0("Gene", 1:100) # Name columns as Gene1, Gene2, ..., Gene10
colnames(data) <- paste0("Sample", 1:10) # Name rows as Sample1, Sample2, ..., Sample100
# Metadata with sample ID and condition
metadata <- data.frame(
SampleID = colnames(data), # Sample ID matches the colnames of the data
Condition = rep(c("A", "B"), each = 5) # Two conditions (A and B)
)
# Example gene set
gene_sets <- list(Signature1 = c("Gene1", "Gene2", "Gene3"),
Signature2 = c("Gene2","Gene4","Gene10"),
Signature3 = c("Gene6","Gene46","Gene13")) # Example gene sets
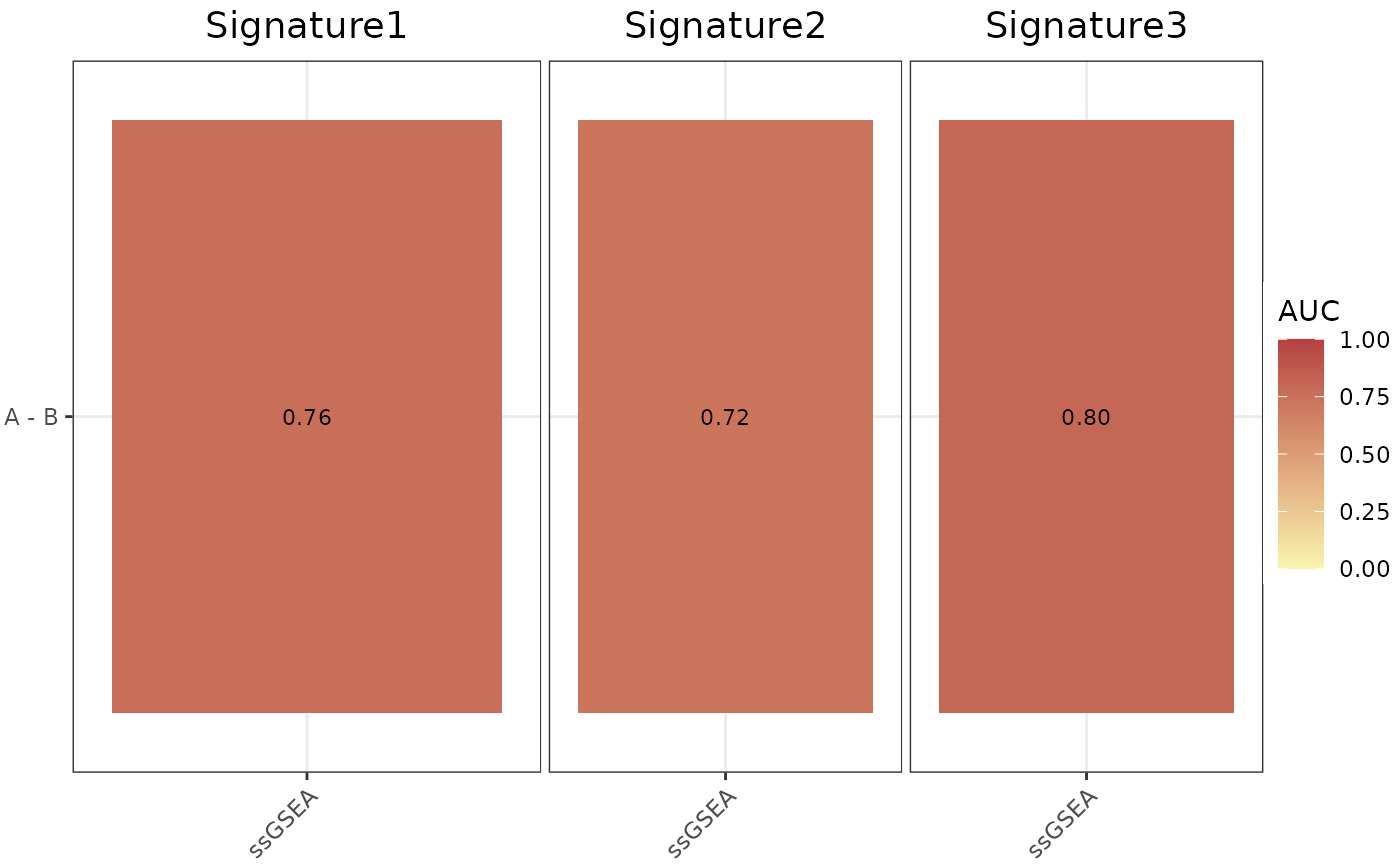
AUC_Scores(
data = data,
metadata = metadata,
gene_sets = gene_sets,
method = "ssGSEA",
variable = "Condition",
nrow = 1,
ncol = NULL,
limits = c(0, 1),
widthTitle = 30,
titlesize = 14,
ColorValues = c("#F9F4AE", "#B44141")
)
#> Considering unidirectional gene signature mode for signature Signature1
#> No id variables; using all as measure variables
#> Considering unidirectional gene signature mode for signature Signature2
#> No id variables; using all as measure variables
#> Considering unidirectional gene signature mode for signature Signature3
#> No id variables; using all as measure variables
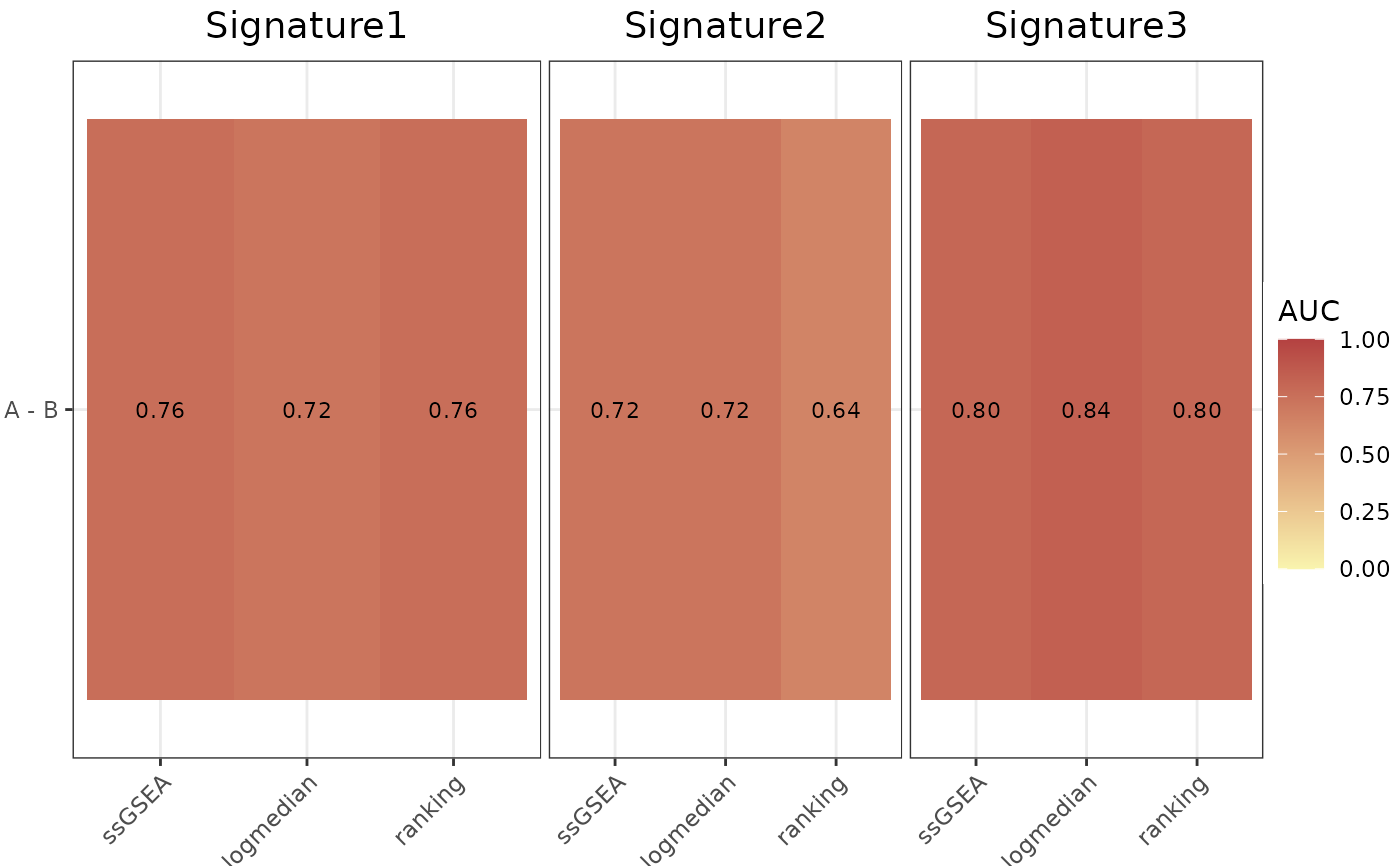
 AUC_Scores(
data = data,
metadata = metadata,
gene_sets = gene_sets,
method = "all",
variable = "Condition",
nrow = 1,
ncol = NULL,
limits = c(0, 1),
widthTitle = 30,
titlesize = 14,
ColorValues = c("#F9F4AE", "#B44141")
)
#> Considering unidirectional gene signature mode for signature Signature1
#> No id variables; using all as measure variables
#> Considering unidirectional gene signature mode for signature Signature2
#> No id variables; using all as measure variables
#> Considering unidirectional gene signature mode for signature Signature3
#> No id variables; using all as measure variables
#> Considering unidirectional gene signature mode for signature Signature1
#> Considering unidirectional gene signature mode for signature Signature2
#> Considering unidirectional gene signature mode for signature Signature3
#> Considering unidirectional gene signature mode for signature Signature1
#> Considering unidirectional gene signature mode for signature Signature2
#> Considering unidirectional gene signature mode for signature Signature3
AUC_Scores(
data = data,
metadata = metadata,
gene_sets = gene_sets,
method = "all",
variable = "Condition",
nrow = 1,
ncol = NULL,
limits = c(0, 1),
widthTitle = 30,
titlesize = 14,
ColorValues = c("#F9F4AE", "#B44141")
)
#> Considering unidirectional gene signature mode for signature Signature1
#> No id variables; using all as measure variables
#> Considering unidirectional gene signature mode for signature Signature2
#> No id variables; using all as measure variables
#> Considering unidirectional gene signature mode for signature Signature3
#> No id variables; using all as measure variables
#> Considering unidirectional gene signature mode for signature Signature1
#> Considering unidirectional gene signature mode for signature Signature2
#> Considering unidirectional gene signature mode for signature Signature3
#> Considering unidirectional gene signature mode for signature Signature1
#> Considering unidirectional gene signature mode for signature Signature2
#> Considering unidirectional gene signature mode for signature Signature3