This function computes Cohen's d for each gene based on gene expression data
and sample metadata. For each gene, it compares the expression values between
samples where condition_var equals class (the positive class)
versus the remaining samples. The resulting effect sizes are then visualized
as a heatmap.
Usage
CohenD_IndividualGenes(
  data,
  metadata,
  genes = NULL,
  condition_var,
  class,
  group_var = NULL,
  title = NULL,
  titlesize = 16,
  params = list()
)
Arguments
- data
A data frame or matrix containing gene expression data, with genes as rows and samples as columns.
- metadata
A data frame containing sample metadata. The first column should contain sample identifiers that match the column names of
data.- genes
A character vector specifying which genes to include. If
NULL(default), all genes indataare used. A warning is issued if more than 30 genes are selected.- condition_var
A character string specifying the column name in
metadatarepresenting the condition of interest. (Mandatory; no default.)- class
A character string or vector specifying the positive class label for the condition. (Mandatory; no default.)
- group_var
An optional character string specifying the column name in
metadataused for grouping samples. If not provided (NULL), all samples are treated as a single group.- title
An optional character string specifying a custom title for the heatmap. If not provided, a default title is generated.
- titlesize
A numeric value specifying the size of the title. Default is
14.- params
A list of additional parameters for customizing the heatmap. Possible elements include:
cluster_rowsLogical; if
TRUE(default), rows are clustered.cluster_columnsLogical; if
TRUE(default), columns are clustered.colorsA vector of length 2 of colors to be used for the minimum and maximum values of the color scale. Defaults to
c("#FFFFFF", "#21975C"), but note that the default mapping for Cohen's d is set to a divergent scale.limitsA numeric vector of length 2 specifying the minimum and maximum values for the color scale. If not provided, defaults to
c(-2, 2).nameA character string for the legend title of the color scale. Default is
"Cohen's d".row_names_gpOptional graphical parameters for row names (passed to ComplexHeatmap).
column_names_gpOptional graphical parameters for column names (passed to ComplexHeatmap).
Value
Invisibly returns a list containing:
plotThe ComplexHeatmap object of the Cohen's d heatmap.
dataA data frame with the calculated Cohen's d values for each gene and group.
Details
This function computes Cohen's d for each gene by comparing the
expression values between samples with condition_var == class and
those that do not. The effect sizes are then visualized as a heatmap using
ComplexHeatmap. When group_var is not provided, all samples are
treated as a single group.
Examples
# Simulate gene expression data (genes as rows, samples as columns)
set.seed(101)
expr <- matrix(abs(rnorm(40)), nrow = 4, ncol = 10) # 4 genes, 10 samples,
# positive values
rownames(expr) <- paste0("Gene", 1:4)
colnames(expr) <- paste0("Sample", 1:10)
# Simulate sample metadata with a binary condition and a group variable
metadata <- data.frame(
Sample = colnames(expr),
Condition = rep(c("Case", "Control"), each = 5),
Group = rep(c("A", "B"), times = 5),
stringsAsFactors = FALSE
)
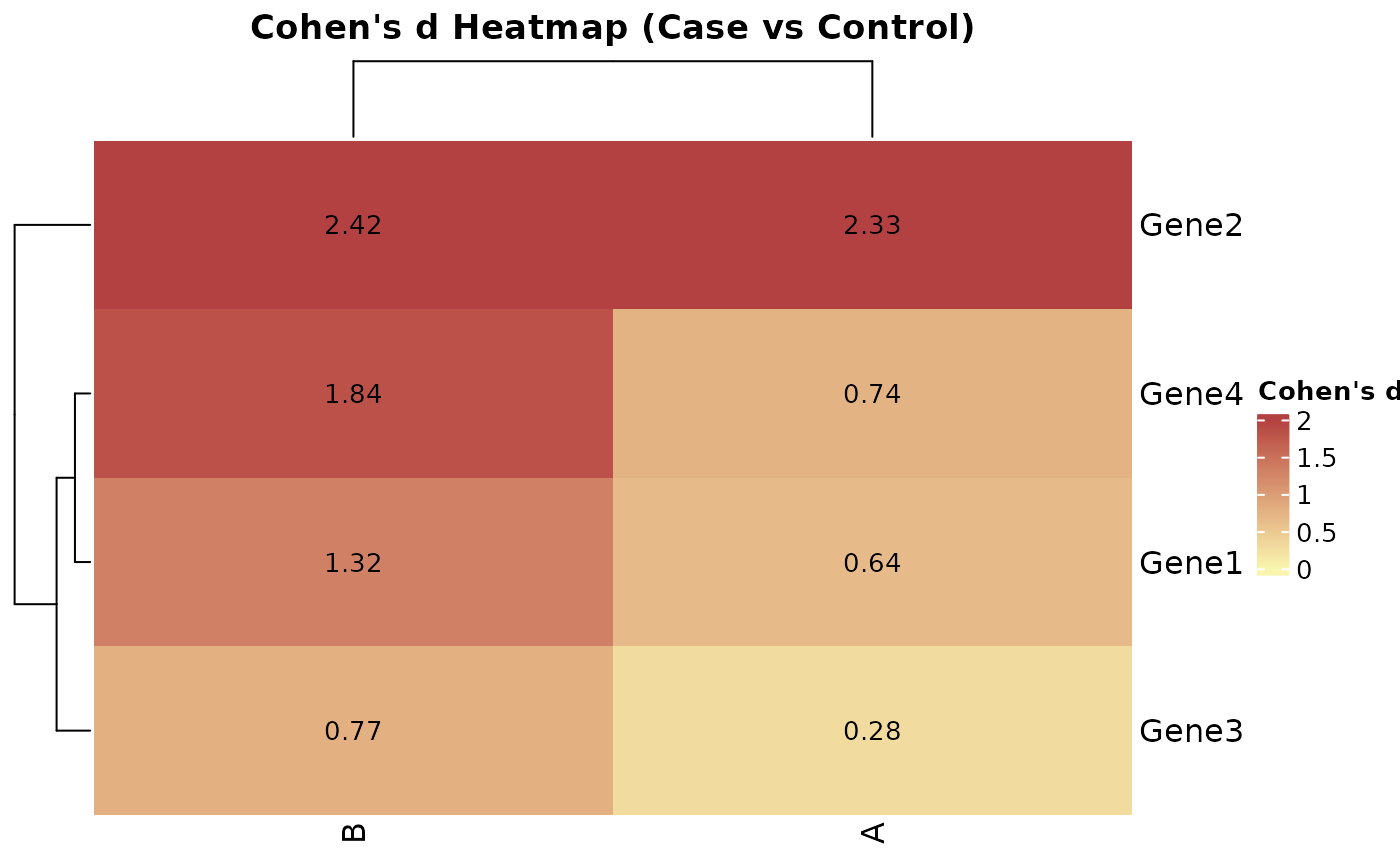
# 1. Cohen's d heatmap for all genes across groups
CohenD_IndividualGenes(
data = expr,
metadata = metadata,
genes = rownames(expr),
condition_var = "Condition",
class = "Case",
group_var = "Group",
title = "Cohen's d Heatmap (Case vs Control)",
params = list(limits = c(0, 2))
)
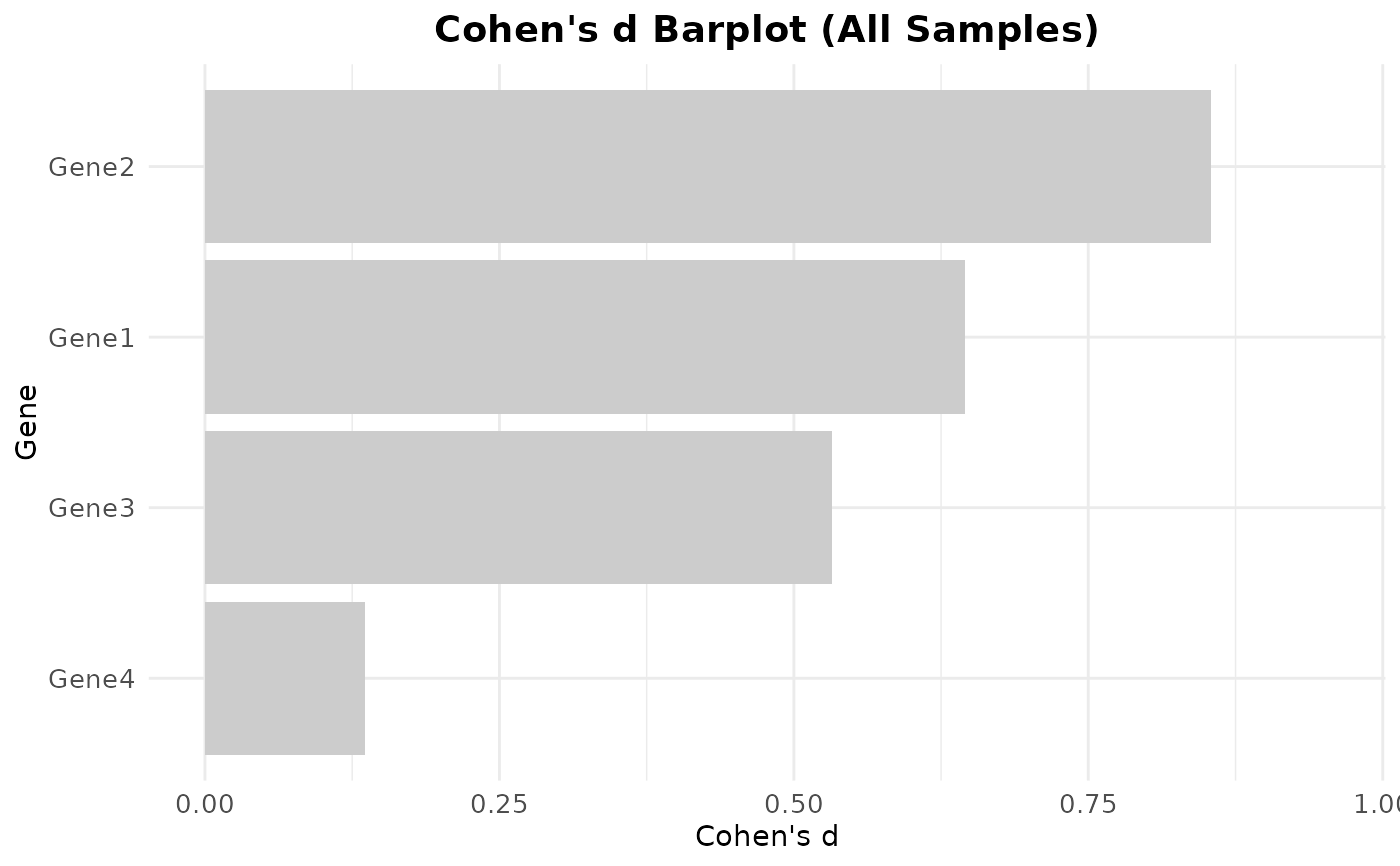
 # 2. Cohen's d barplot (single group across all samples)
CohenD_IndividualGenes(
data = expr,
metadata = metadata,
genes = rownames(expr),
condition_var = "Condition",
class = "Case",
group_var = NULL,
title = "Cohen's d Barplot (All Samples)",
params = list(colors = c("#CCCCCC"))
)
# 2. Cohen's d barplot (single group across all samples)
CohenD_IndividualGenes(
data = expr,
metadata = metadata,
genes = rownames(expr),
condition_var = "Condition",
class = "Case",
group_var = NULL,
title = "Cohen's d Barplot (All Samples)",
params = list(colors = c("#CCCCCC"))
)