CorrelationHeatmap: Generate correlation heatmaps with optional grouping
Source:R/CorrelationHeatmap.R
CorrelationHeatmap.RdThis function generates correlation heatmaps using the ComplexHeatmap
package. It allows users to compute correlation matrices for a set of genes
and visualize them in a heatmap. If a grouping variable is provided
(separate.by), multiple heatmaps are created, each corresponding to a
different level of the grouping variable.
Usage
CorrelationHeatmap(
  data,
  metadata = NULL,
  genes,
  separate.by = NULL,
  method = c("pearson", "spearman", "kendall"),
  colorlist = list(low = "blue", mid = "white", high = "red"),
  limits_colorscale = NULL,
  widthTitle = 16,
  title = NULL,
  cluster_rows = TRUE,
  cluster_columns = TRUE,
  detailedresults = FALSE,
  legend_position = c("right", "top"),
  titlesize = 20,
  show_row_names = TRUE,
  show_column_names = TRUE
)
Arguments
- data
A numeric counts data frame where rows correspond to genes and columns to samples.
- metadata
A data frame containing metadata. Required if
separate.byis specified. The first column should be the sample ID.- genes
A character vector of gene names to be included in the correlation analysis.
- separate.by
A character string specifying a column in
metadatato separate heatmaps by (e.g., "Condition").- method
Correlation method:
"pearson"(default),"spearman", or"kendall".- colorlist
A named list specifying the colors for the heatmap (
low,mid,high), corresponding to the limits of the colorscale.- limits_colorscale
A numeric vector of length 3 defining the limits for the color scale (default: min, 0, max).
- widthTitle
Numeric value controlling the width of the plot title. Default is
16.- title
A string specifying the main title of the heatmap(s).
- cluster_rows
Logical; whether to cluster rows (default =
TRUE).- cluster_columns
Logical; whether to cluster columns (default =
TRUE).- detailedresults
Logical; if
TRUE, additional analysis results are stored in the output list (default =FALSE).- legend_position
Character; position of the legend (
"right"- defaultor
"top").
- titlesize
Numeric; font size of the heatmap title (default =
20).- show_row_names
A character string specifying whether row names (genes) should be displayed.
- show_column_names
A character string specifying whether column names (samples) should be displayed.
Value
A list containing:
dataCorrelation matrices for each condition (or a single matrix if
separate.by = NULL).plotThe generated heatmap object(s).
auxA list containing additional analysis results if
detailedresults = TRUE.
If separate.by is specified, the aux list contains one element per
condition. Each element is a list with:
method: The correlation method used.corrmatrix: The computed correlation matrix for that condition.metadata: The subset of metadata corresponding to the condition.heatmap: TheComplexHeatmapobject before being drawn.
If separate.by = NULL (single heatmap case), the aux list contains:
method: The correlation method.corrmatrix: The computed correlation matrix.
Examples
# Simulate gene expression data (genes as rows, samples as columns)
set.seed(1)
expr <- as.data.frame(matrix(runif(60, min = 0, max = 10), nrow = 6, ncol = 10))
rownames(expr) <- paste0("Gene", 1:6)
colnames(expr) <- paste0("Sample", 1:10)
# Simulate metadata with a group variable
metadata <- data.frame(
SampleID = colnames(expr),
Condition = rep(c("A", "B"), each = 5)
)
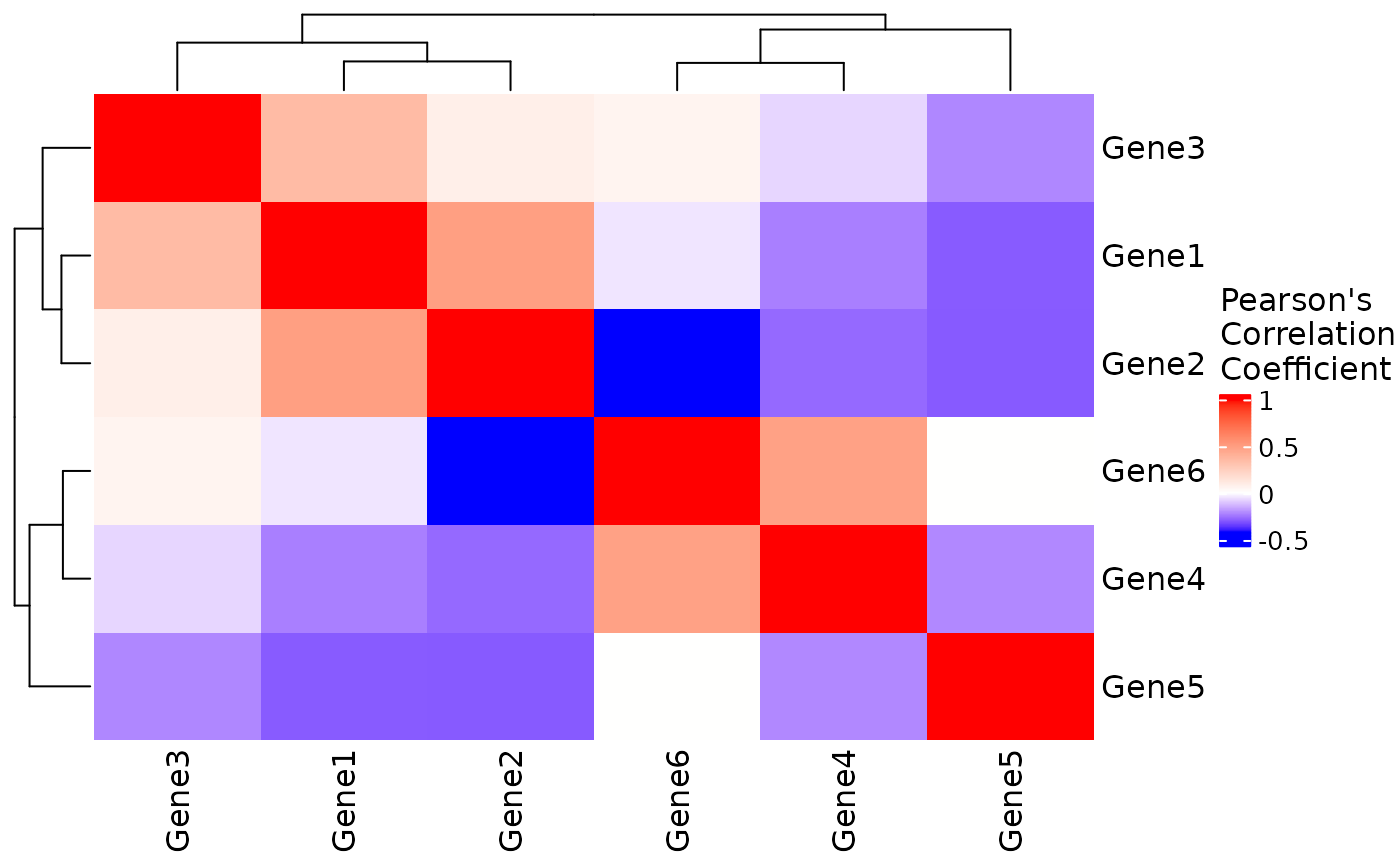
# Basic heatmap for selected genes
res <- CorrelationHeatmap(
data = expr,
genes = rownames(expr)
)
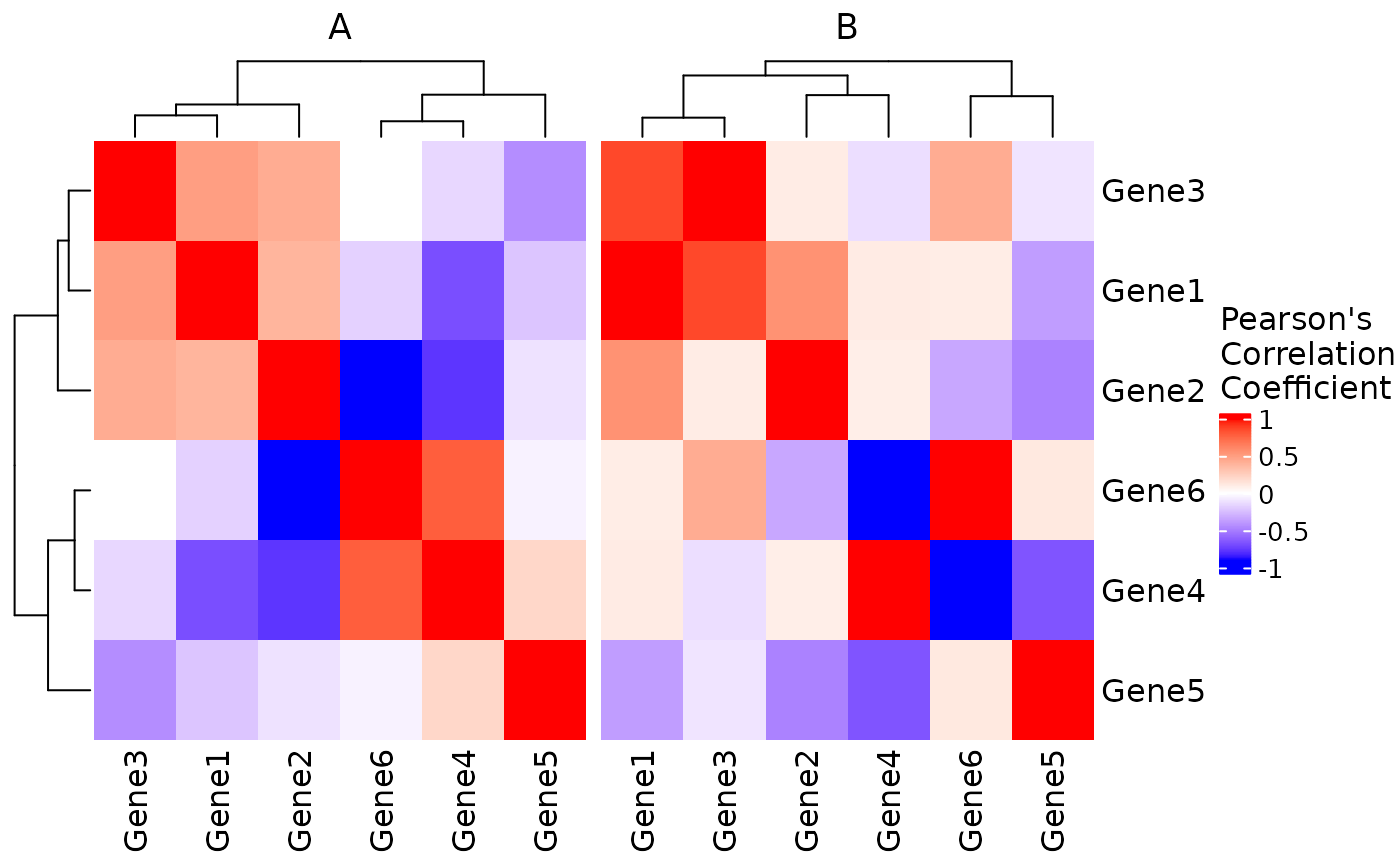
 # Heatmap separated by condition
res_sep <- CorrelationHeatmap(
data = expr,
metadata = metadata,
genes = rownames(expr),
separate.by = "Condition"
)
#> Warning: Heatmap/annotation names are duplicated: Pearson's Correlation
#> Coefficient
#> Warning: `legend_height` you specified is too small, use the default minimal
#> height.
#> Warning: `legend_height` you specified is too small, use the default minimal
#> height.
#> Warning: `legend_height` you specified is too small, use the default minimal
#> height.
# Heatmap separated by condition
res_sep <- CorrelationHeatmap(
data = expr,
metadata = metadata,
genes = rownames(expr),
separate.by = "Condition"
)
#> Warning: Heatmap/annotation names are duplicated: Pearson's Correlation
#> Coefficient
#> Warning: `legend_height` you specified is too small, use the default minimal
#> height.
#> Warning: `legend_height` you specified is too small, use the default minimal
#> height.
#> Warning: `legend_height` you specified is too small, use the default minimal
#> height.