ExpressionHeatmap: Generate an expression heatmap with customizable sample annotations and separate legend positions
Source:R/ExpressionHeatmap.R
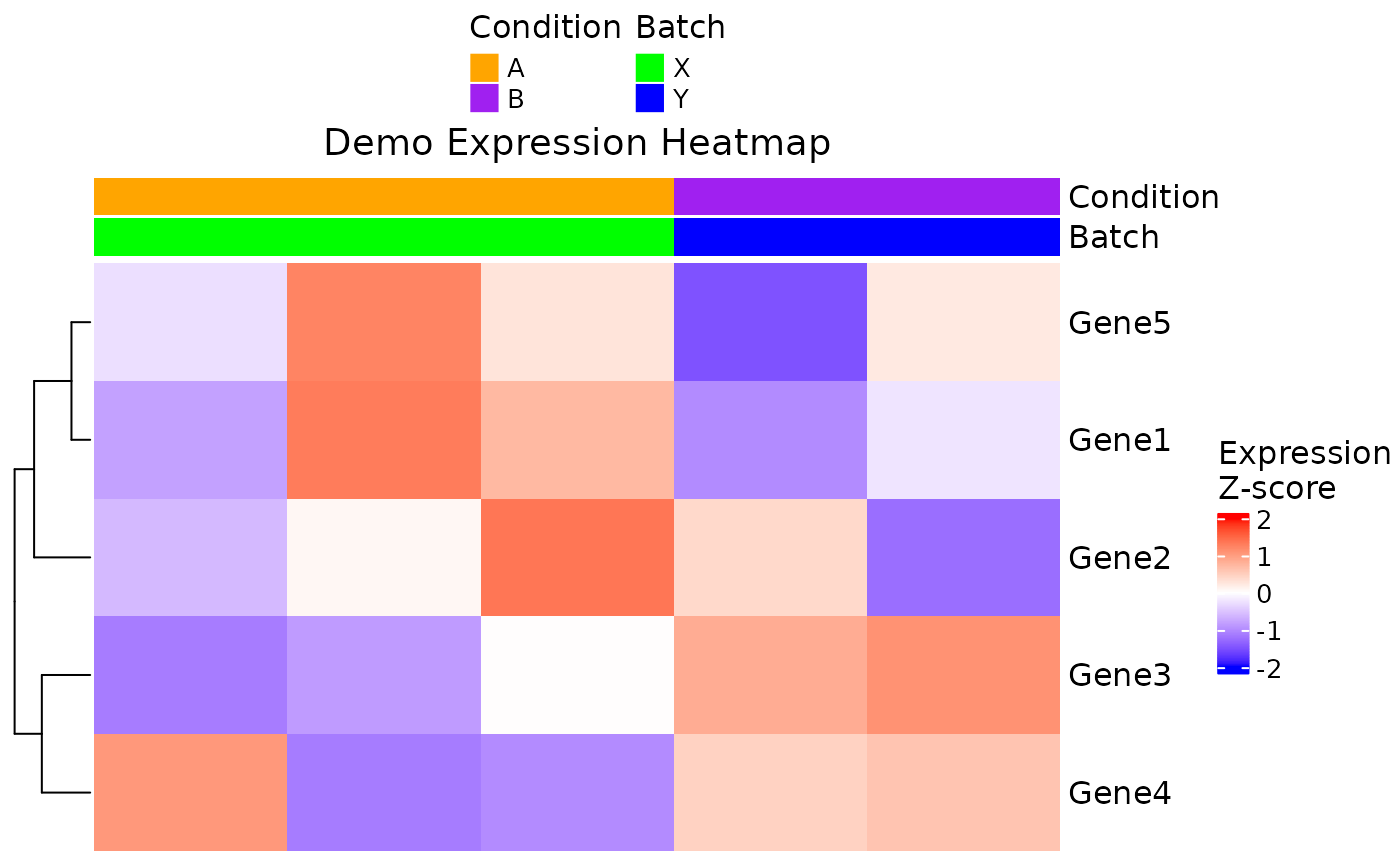
ExpressionHeatmap.RdThis function creates a heatmap of Z-score scaled gene expression using the
ComplexHeatmap package. Genes are displayed as rows and samples as columns.
A color annotation bar is added on top based on specified metadata columns.
The user can control the position of the heatmap color scale (scale_position)
and the annotation legend (legend_position) independently.
Usage
ExpressionHeatmap(
  data,
  metadata = NULL,
  genes,
  annotate.by = NULL,
  annotation_colors = NULL,
  colorlist = list(low = "blue", mid = "white", high = "red"),
  cluster_rows = TRUE,
  cluster_columns = TRUE,
  title = NULL,
  titlesize = 20,
  scale_position = c("right", "top", "bottom"),
  legend_position = c("top", "right", "bottom"),
  show_row_names = TRUE,
  show_column_names = FALSE
)
Arguments
- data
A numeric expression matrix where rows correspond to genes and columns to samples.
- metadata
A data frame containing metadata for the samples. It must contain a column named
"Sample"with sample IDs matching the column names ofdata.- genes
A character vector of gene names to include in the heatmap.
- annotate.by
A character vector of metadata column names to be used for sample annotations (e.g.,
c("Condition", "Batch")). If provided, a color bar is added on top.- annotation_colors
Optional. A named list where each element corresponds to an annotation variable and provides a named vector mapping each unique level to a color. If not provided, default Brewer palettes are used.
- colorlist
A named list specifying the colors for the heatmap (for scaled expression) with elements
low,mid, andhigh. Default islist(low = "blue", mid = "white", high = "red").- cluster_rows
Logical; whether to cluster rows (default =
TRUE).- cluster_columns
Logical; whether to cluster columns (default =
TRUE). IfFALSE, the columns are reordered based on the values inannotate.by.- title
A string specifying the main title of the heatmap.
- titlesize
Numeric; font size of the heatmap title (default = 20).
- scale_position
A character string specifying the position of the heatmap color scale. Options are
"right"(default),"top", or"bottom". The scale legend will adopt a vertical orientation if on the right and horizontal if on top or bottom.- legend_position
A character string specifying the position of the annotation legend. Options are
"top"(default),"right", or"bottom".- show_row_names
A character string specifying whether row names (genes) should be displayed.
- show_column_names
A character string specifying whether column names (samples) should be displayed.
Value
Invisibly returns a list with:
- data
Scaled expression matrix (Z-scores).
- plot
Generated ComplexHeatmap object.
Examples
# Simulate gene expression data (genes as rows, samples as columns)
set.seed(1)
expr <- matrix(rnorm(25), nrow = 5, ncol = 5)
rownames(expr) <- paste0("Gene", 1:5)
colnames(expr) <- paste0("Sample", 1:5)

# Simulate metadata for samples
metadata <- data.frame(
  Sample = colnames(expr),
  Condition = rep(c("A", "B"), length.out = 5),
  Batch = rep(c("X", "Y"), length.out = 5),
  stringsAsFactors = FALSE
)

# Define annotation colors for the metadata variables
annotation_colors <- list(
  Condition = c(A = "orange", B = "purple"),
  Batch = c(X = "green", Y = "blue")
)

# Generate the expression heatmap
ExpressionHeatmap(
  data = expr,
  metadata = metadata,
  genes = rownames(expr),
  annotate.by = c("Condition", "Batch"),
  annotation_colors = annotation_colors,
  cluster_columns = FALSE,
  title = "Demo Expression Heatmap",
  scale_position = "right",
  legend_position = "top",
  titlesize = 14
)