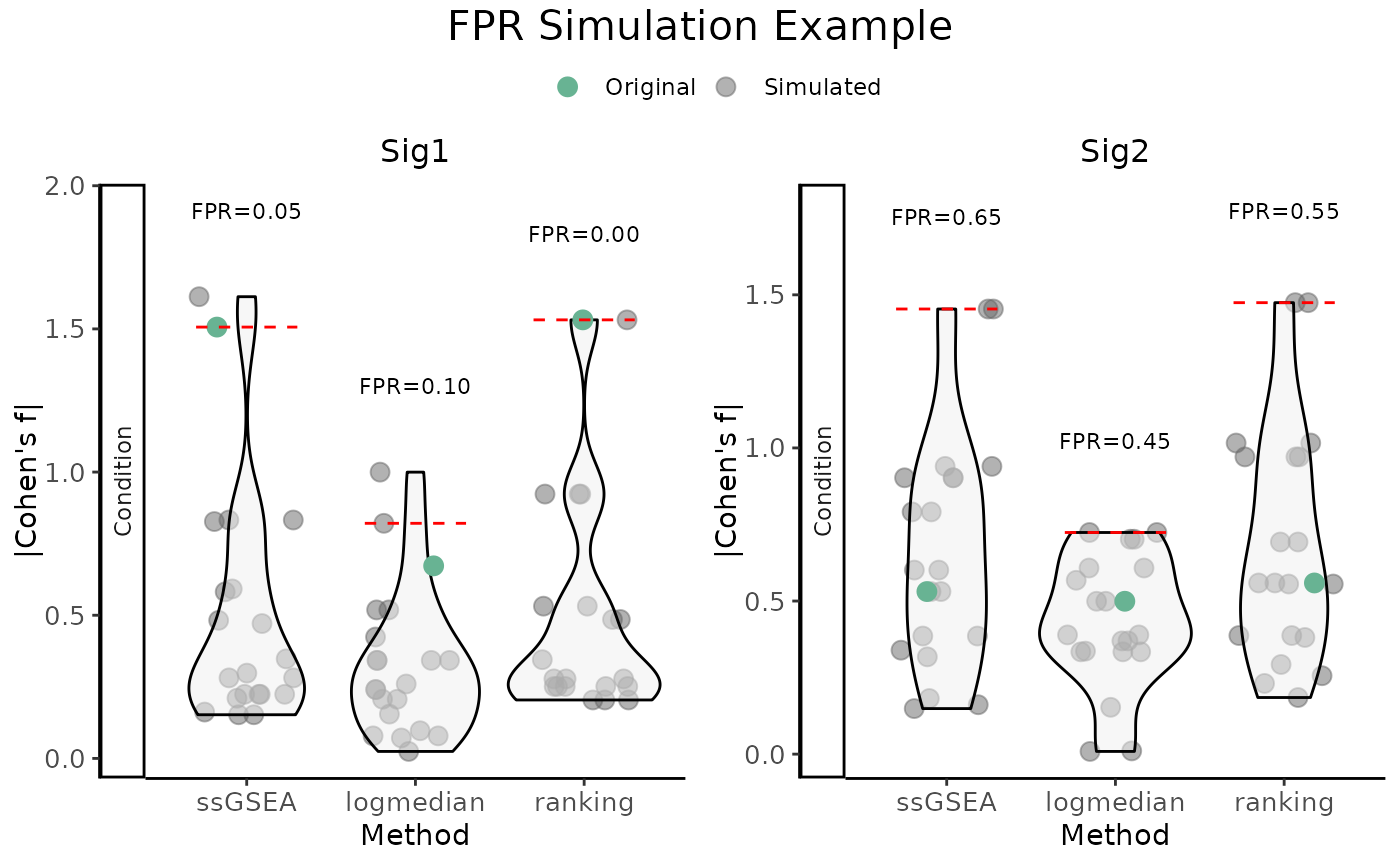
This function simulates false positive rates (FPR) by generating simulated
gene signatures and comparing the observed effect size values (Cohen's d or
f) of the original signatures to those from simulated signatures. The
effect size is computed using three scoring methods (ssGSEA, logmedian,
and ranking), and the results are visualized as violin plots with overlaid
observed values.
Usage
FPR_Simulation(
  data,
  metadata,
  original_signatures,
  Variable,
  gene_list = NULL,
  number_of_sims = 100,
  title = NULL,
  widthTitle = 30,
  titlesize = 12,
  pointSize = 2,
  labsize = 10,
  mode = c("none", "simple", "medium", "extensive"),
  ColorValues = NULL,
  ncol = NULL,
  nrow = NULL,
  p.adjust.method = "BH"
)
Arguments
- data
A data frame or matrix of gene expression values (genes as rows, samples as columns).
- metadata
A data frame containing metadata for the samples (columns of
data).- original_signatures
A named list of gene signatures. Each element can be either:
A vector of gene names (unidirectional), or
A data frame with columns
"Gene"and"Signal"for bidirectional signatures.
- Variable
A column in
metadataindicating the variable of interest for grouping or regression. This can be categorical or numeric.- gene_list
A character vector of gene names from which simulated signatures are generated by sampling. Default is all genes in
data.- number_of_sims
Integer. Number of simulated gene signatures to generate per original signature.
- title
Optional title for the overall plot.
- widthTitle
Integer. Max width for wrapping the title text (default: 30).
- titlesize
Numeric. Font size for the title text (default: 12).
- pointSize
Numeric. Size of the points representing simulations (default: 2).
- labsize
Numeric. Font size for axis labels (default: 10).
- mode
A string specifying the level of detail for contrasts. Options are:
"simple": Performs the minimal number of pairwise comparisons between individual group levels (e.g., A - B, A - C). Default."medium": Includes comparisons between one group and the union of all other groups (e.g., A - (B + C + D)), enabling broader contrasts beyond simple pairs."extensive": Allows for all possible algebraic combinations of group levels (e.g., (A + B) - (C + D)), supporting flexible and complex contrast definitions."none": Comparing all levels ofVariable(default)
- ColorValues
Named vector of colors for plot points, typically
OriginalandSimulated. IfNULL, default colors are used.- ncol
Integer. Number of columns for arranging signature plots in a grid layout. If
NULL, layout is auto-calculated.- nrow
Integer. Number of rows for arranging signature plots in a grid layout. If
NULL, layout is auto-calculated.- p.adjust.method
Character string specifying the method to use for multiple testing correction. Must be one of
"BH"(Benjamini-Hochberg, default),"holm","hommel","bonferroni","BY"(Benjamini-Yekutieli),"fdr", or"none". Passed top.adjust.
Value
Invisibly returns a list containing:
plotA combined
ggplotusingggarrange; one violin plot is generated per signature and contrast. Observed values are highlighted and compared to the simulated distribution. Significance (adjusted p-value \(<=\) 0.05) is indicated by point shape.dataA list of data frames, one for each signature, containing the original and simulated effect sizes.
Details
The function supports both categorical and numeric variables:
For categorical variables, Cohen's d is used and contrasts are defined by the
modeparameter, ifmode!=none.For numeric variables, Cohen's f is used to quantify associations through linear modeling.
For each original gene signature, a number of simulated signatures are
created by sampling genes from gene_list. Each simulated signature is
scored using three methods, and its effect size is computed relative to the
variable of interest. The resulting distributions are shown as violins,
overlaid with the observed value from the original signature. A red dashed
line marks the 95th percentile of the simulated distribution per method.
The function internally uses CohenD_allConditions() and
CohenF_allConditions() depending on variable type.
Examples
# Simulate gene expression matrix (genes as rows, samples as columns)
set.seed(444)
expr <- as.data.frame(matrix(abs(rnorm(60)), nrow = 6, ncol = 10))
rownames(expr) <- paste0("Gene", 1:6)
colnames(expr) <- paste0("Sample", 1:10)

# Simulate sample metadata with a categorical variable
metadata <- data.frame(
  sample = colnames(expr),
  Condition = rep(c("A", "B"), each = 5),
  stringsAsFactors = FALSE
)

# Define two gene signatures (as character vectors)
signatures <- list(
  Sig1 = c("Gene1", "Gene2", "Gene3"),
  Sig2 = c("Gene4", "Gene5")
)

# Run FPR simulation (with fewer sims for speed in example)
FPR_Simulation(
  data = expr,
  metadata = metadata,
  original_signatures = signatures,
  Variable = "Condition",
  number_of_sims = 20,
  title = "FPR Simulation Example",
  pointSize = 3
)
#> Running simulations for signature Sig1
#> Running simulations for signature Sig2