This function computes ROC curves and AUC values for each gene based on gene expression data and sample metadata. It can generate ROC plots, an AUC heatmap / barplot, or both arranged side‐by‐side.
Arguments
- data
A data frame or matrix containing gene expression data, with genes as rows and samples as columns.
- metadata
A data frame containing sample metadata. The first column should contain sample identifiers that match the column names of
data.- genes
A character vector specifying which genes to plot. If
NULL(default), all genes indataare used. A warning is issued if more than 30 genes are selected.- condition_var
A character string specifying the column name in
metadatarepresenting the condition of interest. (Mandatory; no default.)- class
A character string or vector specifying the positive class label for the condition. (Mandatory; no default.)
- group_var
An optional character string specifying the column name in
metadataused for grouping samples (e.g., cell types). If not provided (NULL), all samples are treated as a single group. Should be a categorical variable.- plot_type
A character string indicating which plot(s) to generate. Accepted values are
"roc"(only ROC curves),"auc"(only the AUC heatmap/barplot), or"all"(both arranged side-by-side). Default is"roc".- title
An optional character string specifying the main title of the plot.
- titlesize
A numeric value specifying the size of the title. Default is
14.- roc_params
A list of additional parameters for customizing the ROC plot. Possible elements include:
nrowAn integer specifying the number of rows in the ROC plot grid. If
NULL(default), it is calculated automatically.ncolAn integer specifying the number of columns in the ROC plot grid. If
NULL(default), it is calculated automatically.colorsA named vector of colors for the different groups. If
NULL(default), a default color palette is generated.
- auc_params
A list of additional parameters for customizing the AUC heatmap or AUC barplot. Possible elements include:
cluster_rowsLogical; if
TRUE(default), rows are clustered.cluster_columnsLogical; if
TRUE(default), columns are clustered.colorsIf
group_varis used, should be a vector of length 2 of colors to be used for the minimum and maximum values of the color scale. Defaults toc("#FFFFFF", "#21975C"). Ifgroup_varisNULL, then should be a single color to fill the barplot. IfNULL, defaults to"#3B415B". If a vector is provided, only the first color will be used.limitsA numeric vector of length 2 specifying the minimum and maximum values for the color scale. If not provided, defaults to
c(0.5, 1).nameA character string for the legend title of the color scale. Default is
"AUC".row_names_gpOptional graphical parameters for row names (passed to ComplexHeatmap).
column_names_gpOptional graphical parameters for column names (passed to ComplexHeatmap).
- commomplot_params
A list of parameters for customizing the layout of the combined plot when
plot_type = "all". Possible elements include:widthsA numeric vector specifying the relative widths of the ROC and heatmap panels.
heightsA numeric vector specifying the relative heights of the panels.
Value
Invisibly returns a list containing:
roc_plotThe ggplot2 object of the ROC curves (if generated).
heatmapThe ComplexHeatmap object (if generated).
combinedThe combined grid arrangement (if
plot_type = "all").auc_valuesA data frame with the calculated AUC values.
Details
The function processes gene expression data and metadata to compute
ROC curves and AUC values for each gene. Depending on the value of
plot_type, it produces ROC plots (using ggplot2), an AUC
heatmap (using ComplexHeatmap) or AUC barplot (if group_var is
NULL), or both arranged side-by-side (using gridExtra).
Examples
# Simulate positive gene expression data (genes as rows, samples as columns)
set.seed(123)
expr <- matrix(rexp(30, rate = 0.5), nrow = 3, ncol = 10) # 3 genes, 10 samples, >0
rownames(expr) <- paste0("Gene", 1:3)
colnames(expr) <- paste0("Sample", 1:10)
# Simulate metadata with a condition (binary class) and a grouping variable
metadata <- data.frame(
SampleID = colnames(expr),
Condition = rep(c("A", "B"), each = 5),
Group = rep(c("G1", "G2"), times = 5)
)
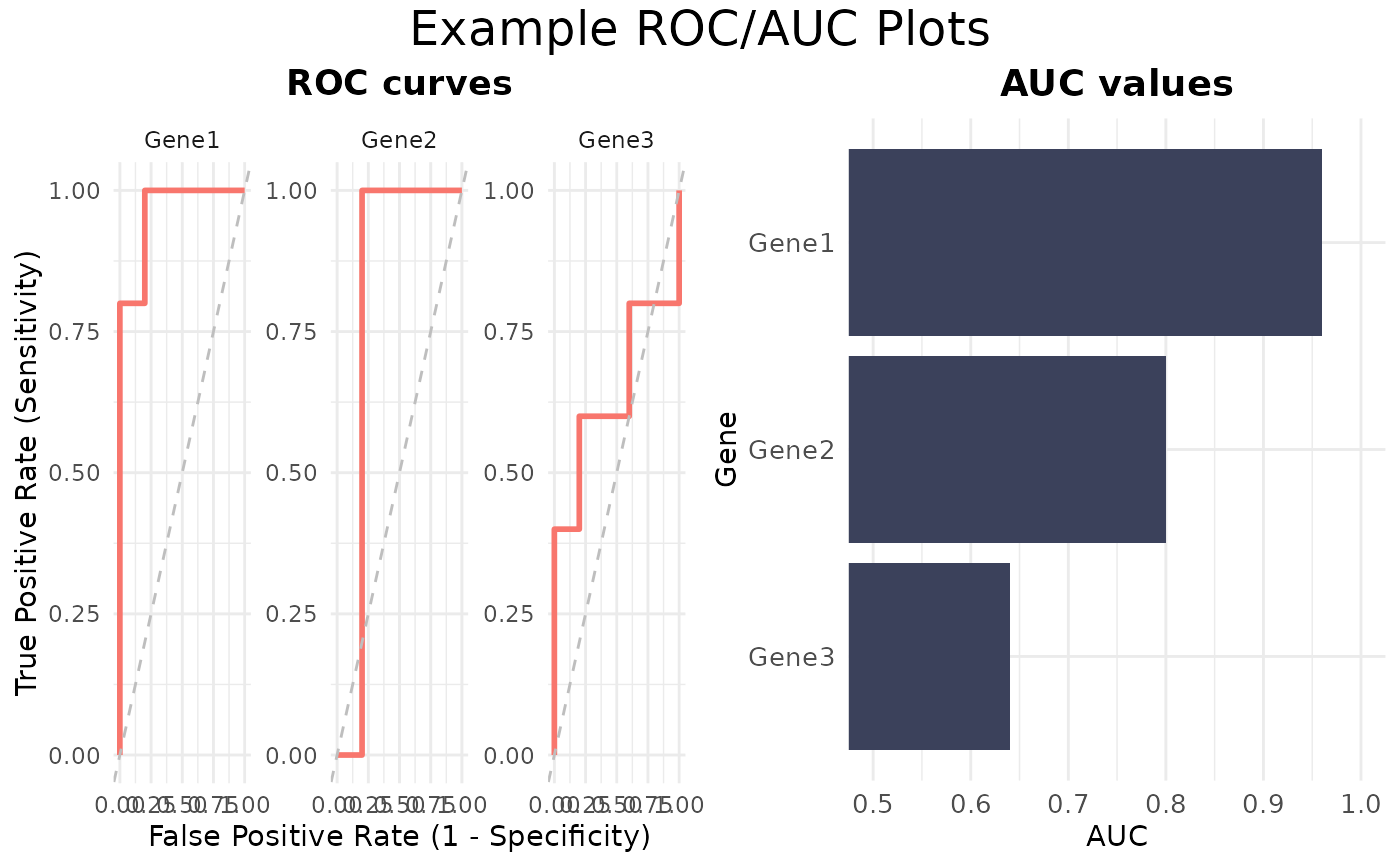
# Run ROCandAUCplot with both ROC and AUC plots for three genes
ROCandAUCplot(
data = expr,
metadata = metadata,
genes = rownames(expr),
condition_var = "Condition",
class = "A",
plot_type = "all",
title = "Example ROC/AUC Plots",
roc_params = list(nrow=1)
)