This function generates enrichment plots for gene sets using the
fgsea::plotEnrichment() function. It supports both individual plots
(returned as a list) and a grid layout using ggpubr::ggarrange().
Usage
plotGSEAenrichment(
  GSEA_results,
  DEGList,
  gene_sets,
  widthTitle = 24,
  grid = FALSE,
  nrow = NULL,
  ncol = NULL,
  titlesize = 12
)
Arguments
- GSEA_results
A named list of data frames containing GSEA results for each contrast. Each data frame should have a column named
pathwayspecifying the gene set, and columnsNESandpadjfor results. Output fromrunGSEA.- DEGList
A named list of data frames containing differentially expressed genes (DEGs) for each contrast. Each data frame must include a column named
twith t-statistics for ranking genes. Output fromcalculateDE.- gene_sets
A named list of gene sets, where each entry is either:
A vector of gene names (unidirectional gene set)
A data frame with two columns: gene names and direction (+1 for enriched and -1 for depleted).
- widthTitle
Integer. The maximum width (in characters) for wrapping plot titles. Default is 24.
- grid
Logical. If
TRUE, plots are arranged in a grid usingggpubr::ggarrange(). Default isFALSE.- nrow
Integer. Number of rows for the grid layout (used only if
grid = TRUE). IfNULL, it is auto-calculated.- ncol
Integer. Number of columns for the grid layout (used only if
grid = TRUE). IfNULL, it is auto-calculated.- titlesize
Integer. Font size for plot titles. Default is 12.
Value
If grid = FALSE, returns a named list of ggplot objects (each plot
corresponding to a contrast-signature pair). If grid = TRUE, returns a
single ggplot object with all enrichment plots arranged in a grid.
Examples
# Example GSEA results (mock data, missing columns if running by runGSEA)
GSEA_results <- list(
"Contrast1" = data.frame(
NES = rnorm(3),
padj = runif(3),
pathway = paste("Pathway", 1:3),
stat_used = c("t", "B", "B")
),
"Contrast2" = data.frame(
NES = rnorm(3),
padj = runif(3),
pathway = paste("Pathway", 4:6),
stat_used = c("t", "B", "B")
)
)
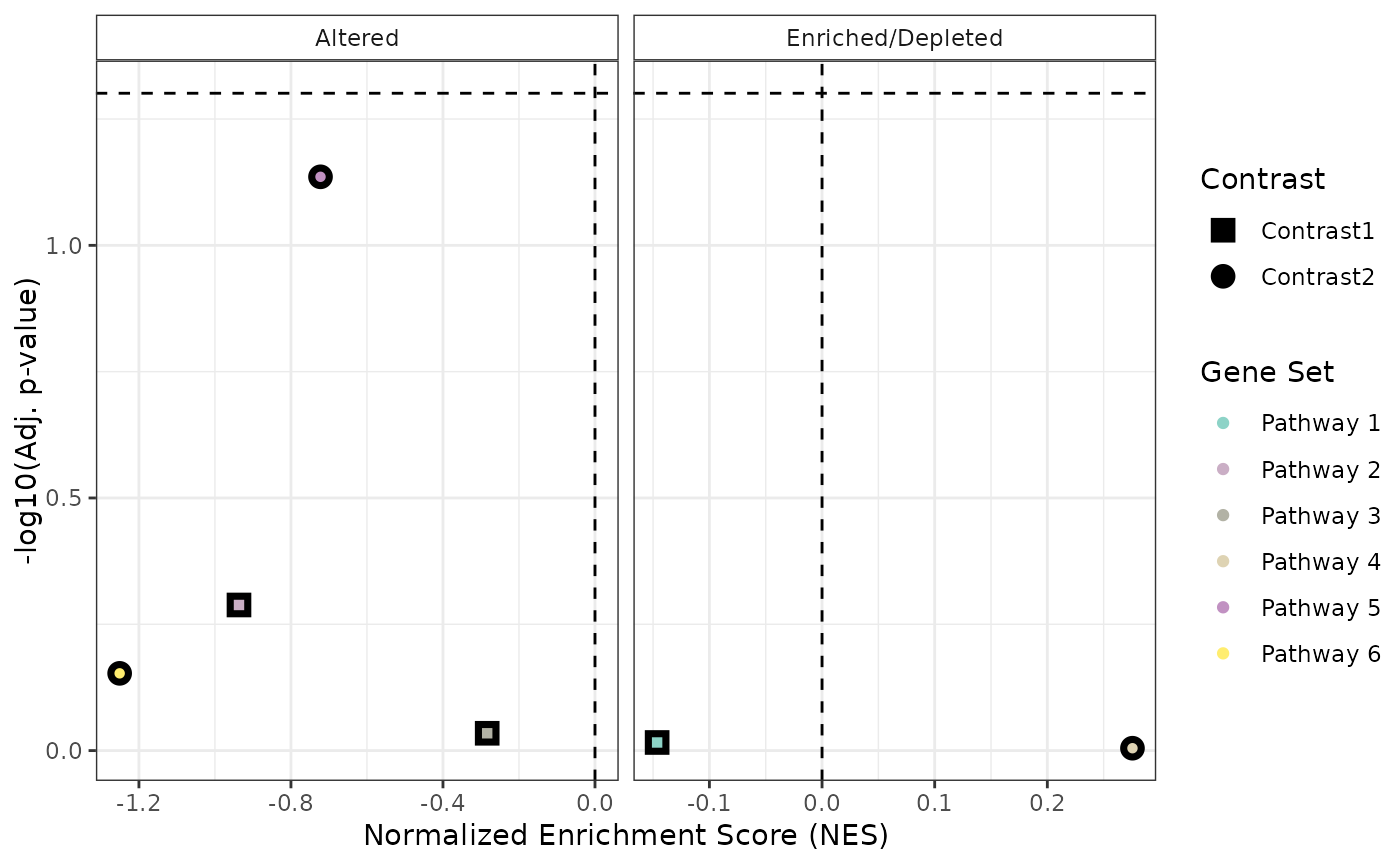
# Generate the plot
plot <- plotCombinedGSEA(GSEA_results, sig_threshold = 0.05, PointSize = 7)
print(plot)