This function generates a lollipop plot to visualize Gene Set Enrichment
Analysis (GSEA) results. Pathways are shown on the y-axis, while the
Normalized Enrichment Score (NES) is shown on the x-axis. The color of the
lollipops represents the adjusted p-values (padj), with a custom color
gradient. It supports multiple contrasts and can combine individual plots
into a grid layout.
Usage
plotNESlollipop(
  GSEA_results,
  signif_color = "red",
  nonsignif_color = "white",
  sig_threshold = 0.05,
  saturation_value = NULL,
  pointSize = 5,
  grid = FALSE,
  nrow = NULL,
  ncol = NULL,
  widthlabels = 18,
  title = NULL,
  titlesize = 12
)
Arguments
- GSEA_results
A named list of data frames, each containing the GSEA results for a specific contrast. Output from
runGSEA. Each data frame must include the following columns:- pathway
A character vector of pathway names.
- NES
A numeric vector of Normalized Enrichment Scores for the pathways.
- padj
A numeric vector of adjusted p-values for the pathways.
- signif_color
A string specifying the color for the low end of the adjusted p-value gradient until the value chosen for significance (
sig_threshold). Default is"red".- nonsignif_color
A string specifying the color for the middle of the adjusted p-value gradient. Default is
"white". Lower limit correspond to the value ofsig_threshold.- sig_threshold
A numeric value that sets the midpoint for the color scale. Typically used for the significance threshold. Default is
0.05.- saturation_value
A numeric value specifying the lower limit of the adjusted p-value gradient, below which the color will correspond to
signif_color. Default is the results' minimum, unless that value is above the sig_threshold; in that case, it is 0.001.- pointSize
Numeric. The size of points in the lollipop plot (default is 5).
- grid
A logical value indicating whether to arrange individual plots into a grid layout. If
TRUE, the function combines all plots into a grid. Default isFALSE.- nrow
A numeric value specifying the number of rows to arrange the plots into if
grid = TRUE. IfNULL, the function calculates this automatically. Default isNULL.- ncol
A numeric value specifying the number of columns to arrange the plots into if
grid = TRUE. IfNULL, the function calculates this automatically. Default isNULL.- widthlabels
A numeric value specifying the maximum width for pathway names. If a pathway name exceeds this width, it will be wrapped to fit. Default is
18.- title
A character string for the title of the combined plot (used only when
grid = TRUE). Default isNULL.- titlesize
A numeric value specifying the font size for the title (used only when
grid = TRUE). Default is12.
Value
If grid = FALSE, a list of ggplot objects is returned, each
corresponding to a contrast. If grid = TRUE, a single ggplot object is
returned, representing the combined grid of plots.
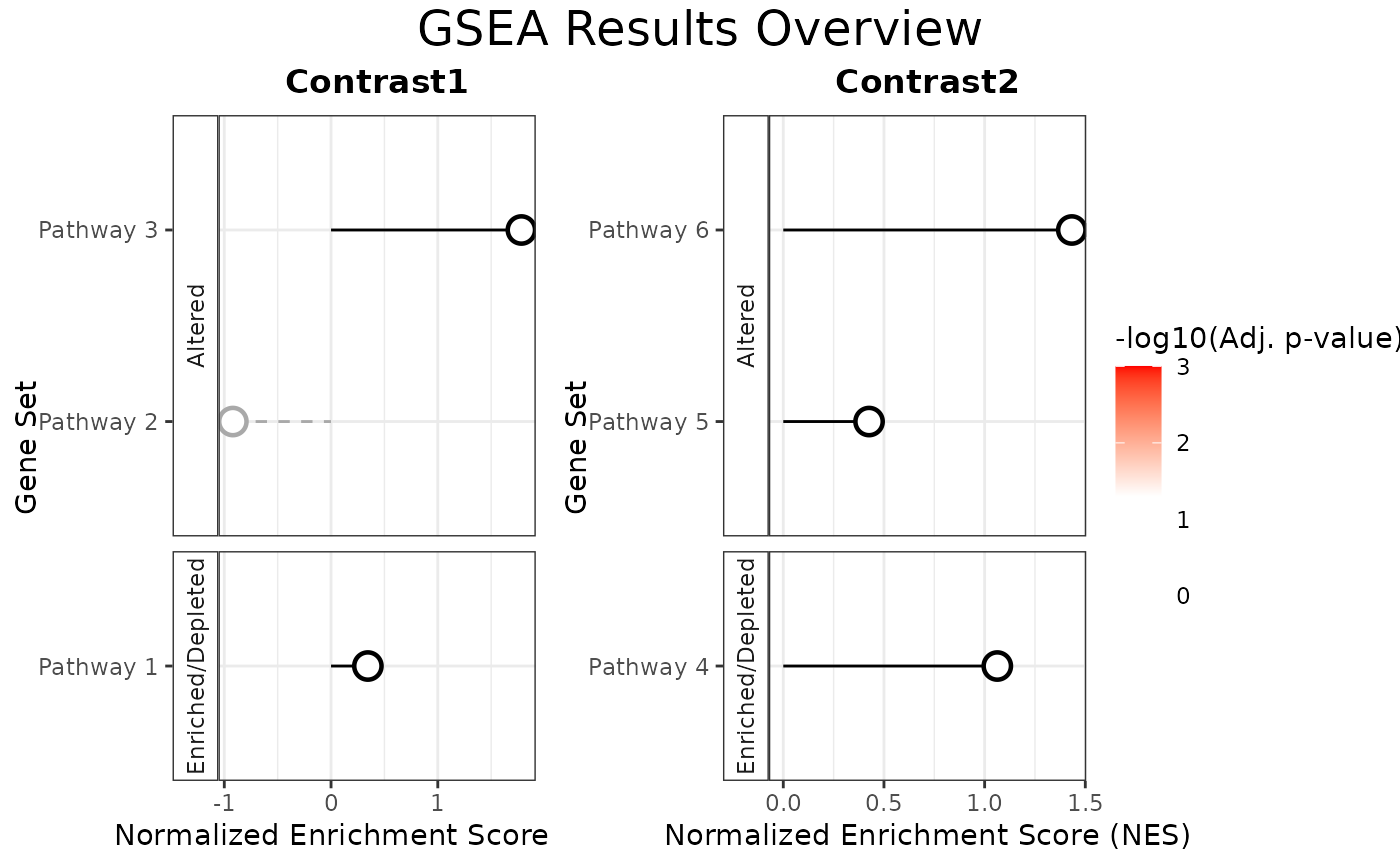
Details
The function creates a lollipop plot for each contrast in the
GSEA_results list. Each plot includes:
A vertical segment for each pathway, where the x-coordinate represents the NES and the y-coordinate represents the pathway.
A colored point at the end of each segment, where the color represents the adjusted p-value (
padj), mapped using a custom color gradient.
If a pathway's padj value exceeds the maximum value in padj_limit, the
corresponding pathway is colored using the high_color. Additionally,
missing values (NA) for padj are assigned the high_color by setting
na.value = high_color. Pathway names are wrapped using the wrap_title
function to fit within the specified width (widthlabels).
Examples
# Example GSEA results (mock data, missing columns if running by runGSEA)
GSEA_results <- list(
"Contrast1" = data.frame(
NES = rnorm(3),
padj = runif(3),
pathway = paste("Pathway", 1:3),
stat_used = c("t", "B", "B")
),
"Contrast2" = data.frame(
NES = rnorm(3),
padj = runif(3),
pathway = paste("Pathway", 4:6),
stat_used = c("t", "B", "B")
)
)
# Generate individual plots without grid
plot_list <- plotNESlollipop(GSEA_results)
plot_list
#> $Contrast1
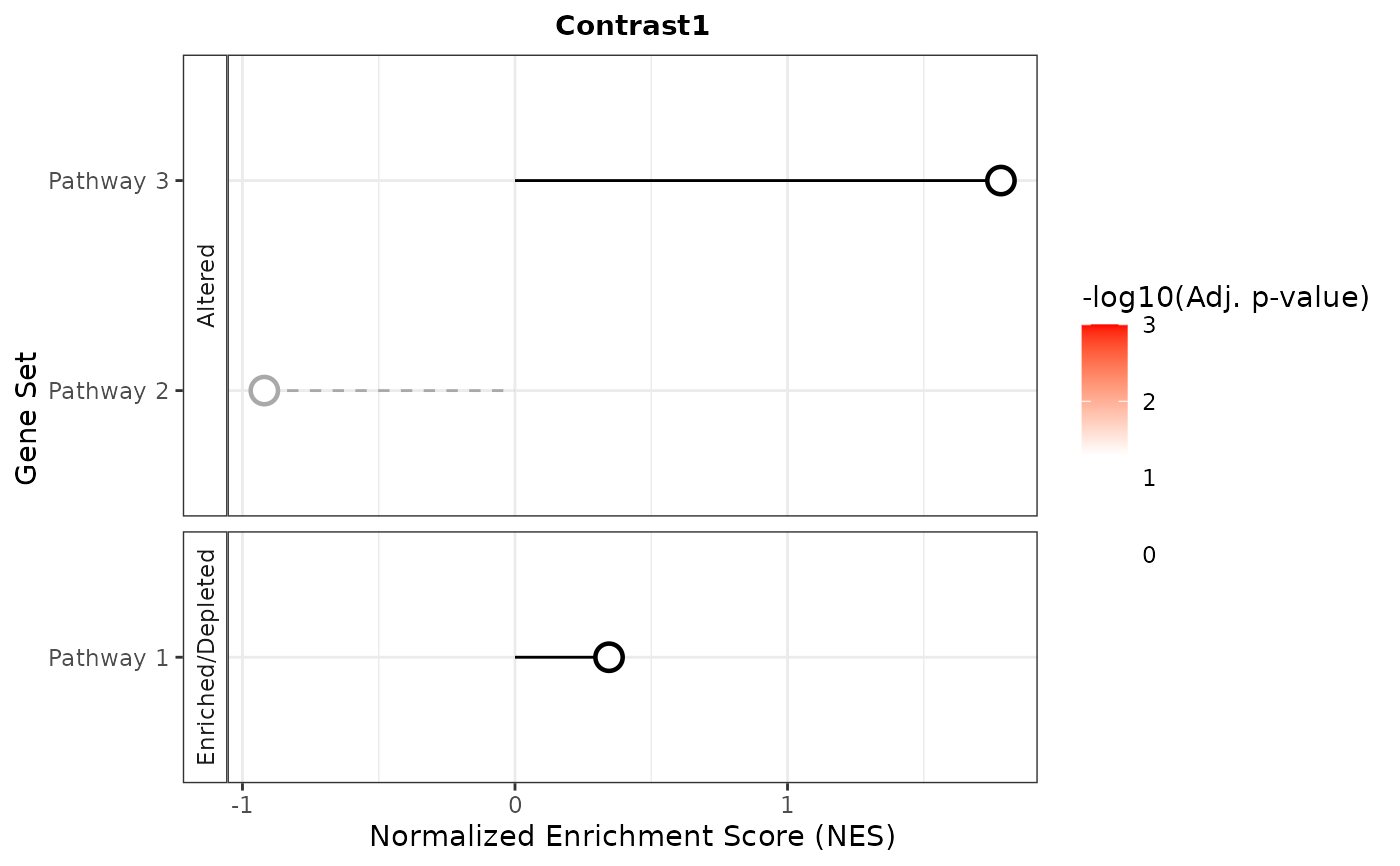 #>
#> $Contrast2
#>
#> $Contrast2
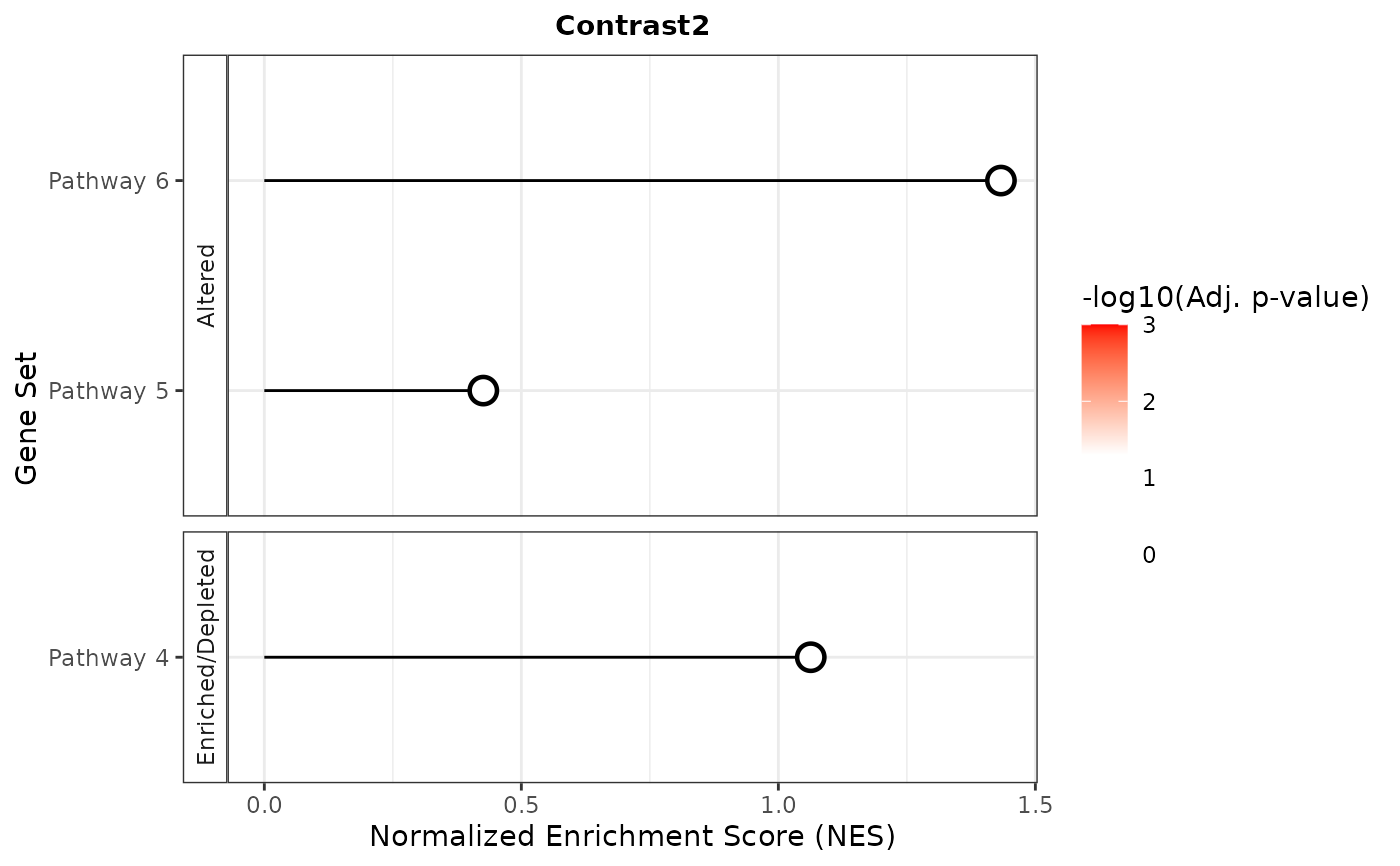 #>
# Generate combined grid of plots with custom title
combined_plot <- plotNESlollipop(GSEA_results, grid = TRUE,
title = "GSEA Results Overview", titlesize = 14)
combined_plot
#>
# Generate combined grid of plots with custom title
combined_plot <- plotNESlollipop(GSEA_results, grid = TRUE,
title = "GSEA Results Overview", titlesize = 14)
combined_plot