This function performs PCA on a given dataset and visualizes the results using ggplot2. It allows users to specify genes of interest, customize scaling and centering, and color points based on a metadata variable.
Arguments
- data
A numeric matrix or data frame where rows represent genes and columns represent samples.
- metadata
A data frame containing sample metadata. The first column should contain sample names. Default is NULL.
- genes
A character vector specifying genes to be included in the PCA. Default is NULL (uses all genes).
- scale
Logical; if TRUE, variables are scaled before PCA. Default is FALSE.
- center
Logical; if TRUE, variables are centered before PCA. Default is TRUE.
- PCs
A list specifying which principal components (PCs) to plot. Default is
list(c(1,2)).- ColorVariable
A character string specifying the metadata column used for coloring points. Default is NULL.
- ColorValues
A vector specifying custom colors for groups in
ColorVariable. Default is NULL.- pointSize
Numeric; sets the size of points in the plot. Default is 5.
- legend_nrow
Integer; number of rows in the legend. Default is 2.
- legend_position
Character; position of the legend ("bottom", "top", "right", "left"). Default is "bottom".
- ncol
Integer; number of columns in the arranged PCA plots. Default is determined automatically.
- nrow
Integer; number of rows in the arranged PCA plots. Default is determined automatically.
Value
A list with two elements:
plt: A ggplot2 or ggarrange object displaying the PCA plot.data: A data frame containing PCA-transformed values and sample metadata (if available).
Details
The function performs PCA using prcomp() and visualizes the
results using ggplot2. If a metadata data frame is provided, it
ensures the sample order matches between data and metadata.
Examples
# Example dataset
set.seed(123)
data <- abs(matrix(rnorm(1000), nrow=50, ncol=20))
colnames(data) <- paste0("Sample", 1:20)
rownames(data) <- paste0("Gene", 1:50)
metadata <- data.frame(Sample = colnames(data),
Group = rep(c("A", "B"), each = 10))
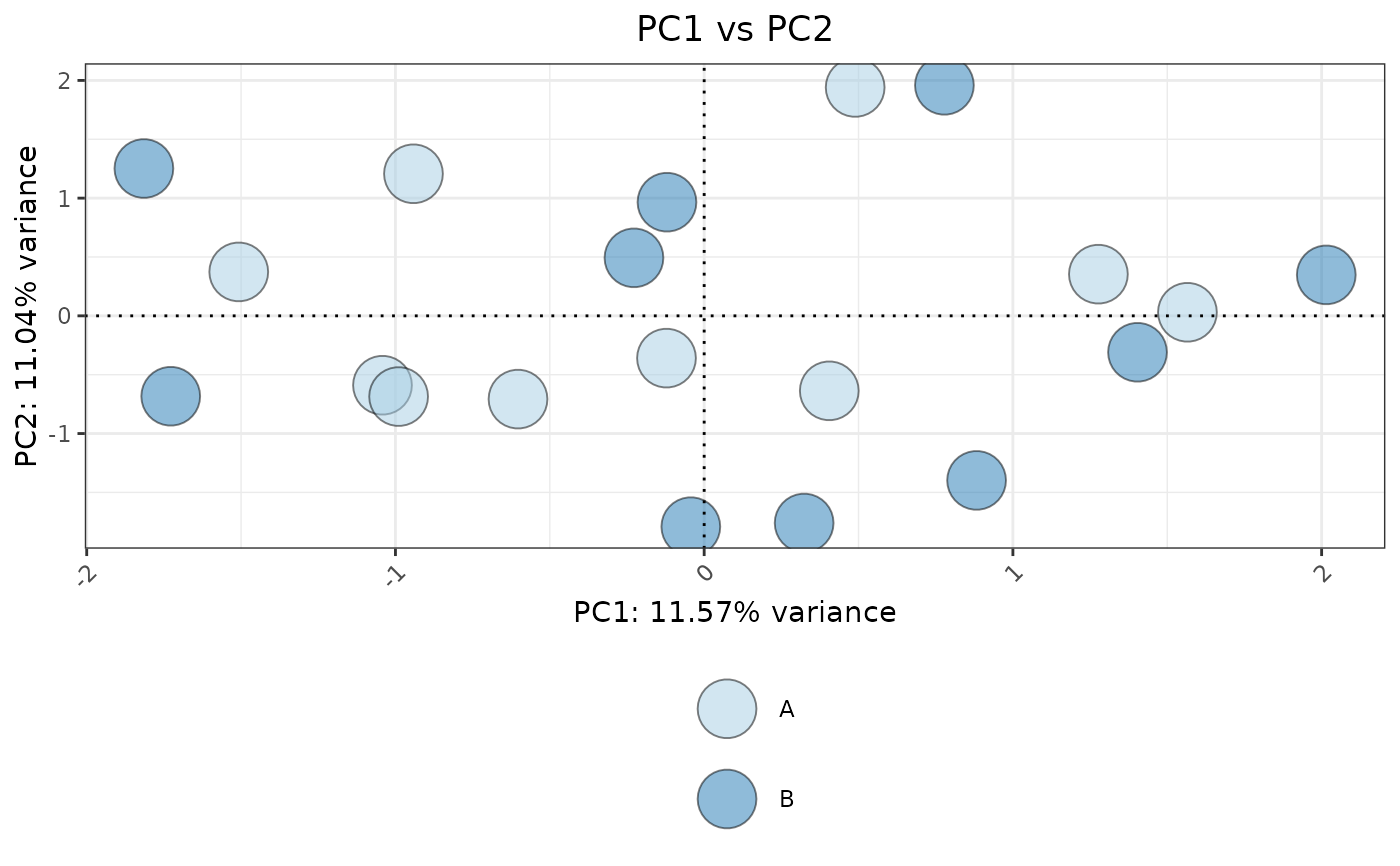
# Basic PCA plot
plotPCA(data, metadata, ColorVariable = "Group", pointSize = 10)
 set.seed(42)
n_genes <- 100
n_samples <- 10
# Group A: samples 1-5, lower mean
group_A <- matrix(rlnorm(n_genes * 5, meanlog = 1, sdlog = 0.3), nrow = n_genes)
# Group B: samples 6-10, higher mean
group_B <- matrix(rlnorm(n_genes * 5, meanlog = 2, sdlog = 0.3), nrow = n_genes)
# Combine
data <- cbind(group_A, group_B)
colnames(data) <- paste0("Sample", 1:n_samples)
rownames(data) <- paste0("Gene", 1:n_genes)
# Metadata
metadata <- data.frame(Sample = colnames(data),
Group = rep(c("A", "B"), each = 5))
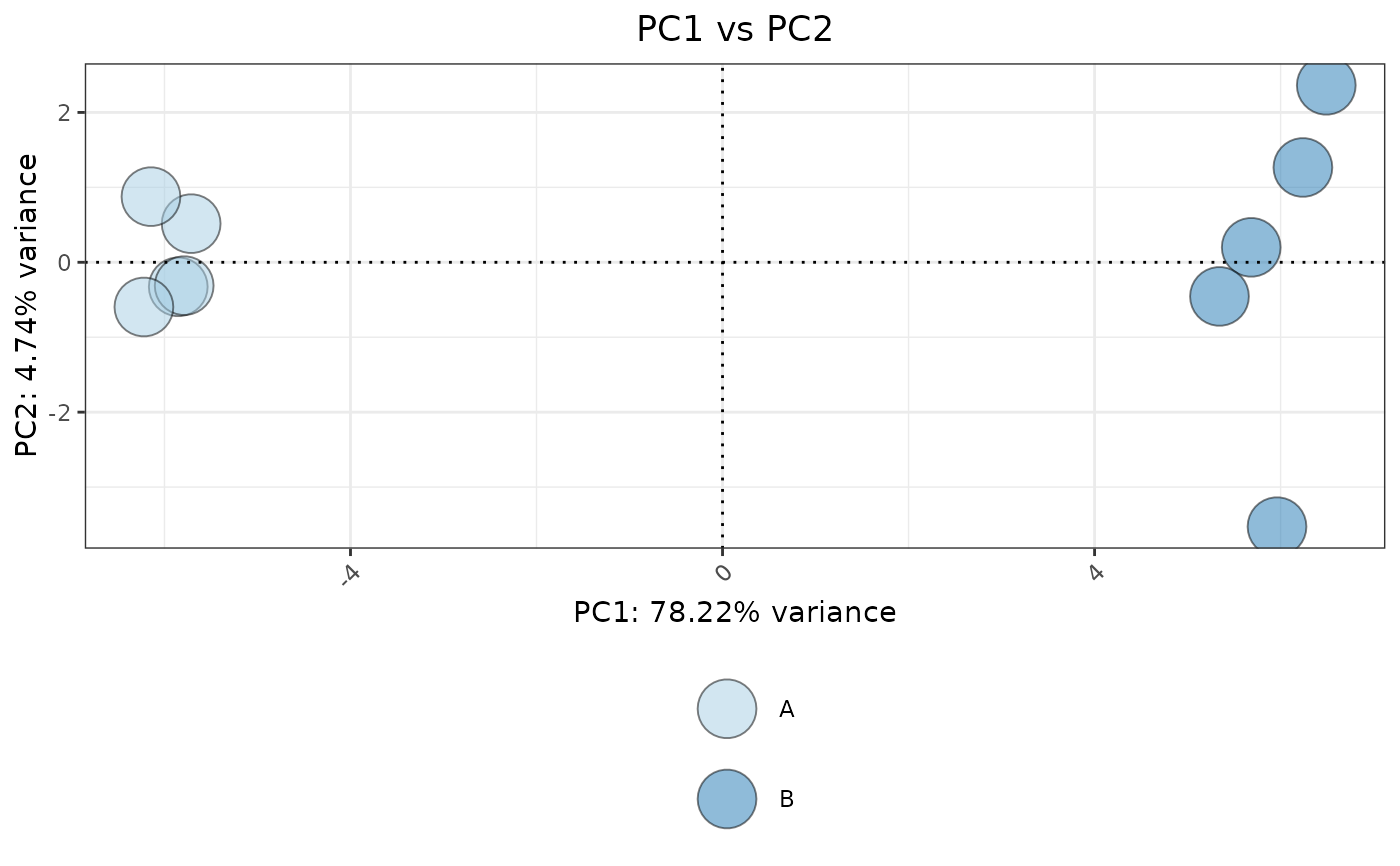
# Plot PCA
plotPCA(data, metadata, ColorVariable = "Group", pointSize = 10)
set.seed(42)
n_genes <- 100
n_samples <- 10
# Group A: samples 1-5, lower mean
group_A <- matrix(rlnorm(n_genes * 5, meanlog = 1, sdlog = 0.3), nrow = n_genes)
# Group B: samples 6-10, higher mean
group_B <- matrix(rlnorm(n_genes * 5, meanlog = 2, sdlog = 0.3), nrow = n_genes)
# Combine
data <- cbind(group_A, group_B)
colnames(data) <- paste0("Sample", 1:n_samples)
rownames(data) <- paste0("Gene", 1:n_genes)
# Metadata
metadata <- data.frame(Sample = colnames(data),
Group = rep(c("A", "B"), each = 5))
# Plot PCA
plotPCA(data, metadata, ColorVariable = "Group", pointSize = 10)