This function creates a composite volcano plot grid from a list of
differential expression results., or a single volcano if no genes to highlight
are provided and no more than one contrast is used. For each contrast
(provided in DEResultsList) and gene signature (from the genes
argument), a volcano plot is generated using the specified x and y statistics.
By default, if invert = FALSE and more than one gene signature is
provided (i.e. the names in genes are not "ALL" or "genes"), the plots
are arranged with gene signatures in rows and contrasts in columns. When
invert = TRUE, the arrangement is reversed (signatures in columns and
contrasts in rows). If only one gene signature is provided, an automatic grid
is computed.
Usage
plotVolcano(
  DEResultsList,
  genes = NULL,
  N = NULL,
  x = "logFC",
  y = "-log10(adj.P.Val)",
  pointSize = 2,
  color = "#6489B4",
  highlightcolor = "#05254A",
  highlightcolor_upreg = "#038C65",
  highlightcolor_downreg = "#8C0303",
  nointerestcolor = "#B7B7B7",
  threshold_y = NULL,
  threshold_x = NULL,
  xlab = NULL,
  ylab = NULL,
  ncol = NULL,
  nrow = NULL,
  title = NULL,
  labsize = 10,
  widthlabs = 20,
  invert = FALSE
)
Arguments
- DEResultsList
A named list of data frames containing differential expression results for each contrast. Each data frame should have row names corresponding to gene names and include columns for the x and y statistics. Output from
calculateDE.- genes
Optional. A list of gene signatures to highlight. Each element may be a data frame (in which case its first column is extracted) or a vector of gene names. If
NULL, no genes will be highlighted.- N
Optional. An integer specifying the number of top (and bottom) genes to annotate with text labels.
- x
Character. The column name in the differential expression results to use for the x-axis (default is
"logFC").- y
Character. The column name to use for the y-axis (default is
"-log10(adj.P.Val)"). When using this default, threshold values forthreshold_yshould be provided in non-log scale (e.g., 0.05).- pointSize
Numeric. The size of points in the volcano plots (default is 2).
- color
Character. The color used to highlight interesting genes based on thresholds (default is
"#6489B4").- highlightcolor
Character. The color used to highlight genes belonging to the specified gene signatures (default is
"#05254A"), if direction is not known or not specified.- highlightcolor_upreg
Character. The color used to highlight upregulated genes belonging to the specified gene signatures (default is
"#038C65").- highlightcolor_downreg
Character. The color used to highlight downregulated genes belonging to the specified gene signatures (default is
"#8C0303").- nointerestcolor
Character. The color for non-interesting genes (default is
"#B7B7B7").- threshold_y
Numeric. A threshold value for the y-axis statistic. If
yis"-log10(adj.P.Val)", the value should be provided as a non-log value (e.g., 0.05) and will be transformed internally.- threshold_x
Numeric. A threshold value for the x-axis statistic.
- xlab
Optional. A label for the x-axis; if
NULL, the value ofxis used.- ylab
Optional. A label for the y-axis; if
NULL, the value ofyis used.- ncol
Optional. The number of columns for arranging plots in the grid. Only applicable if
genesisNULL.- nrow
Optional. The number of rows for arranging plots in the grid.
- title
Optional. A main title for the entire composite plot.
- labsize
Numeric. The font size for label annotations (default is 10). The title size will be this value + 4.
- widthlabs
Numeric. The width parameter to pass to the
wrap_title()function for wrapping long labels (default is 20).- invert
Logical. If
FALSE(default), the grid is arranged with gene signatures in rows and contrasts in columns. IfTRUE, the arrangement is inverted (gene signatures in columns and contrasts in rows).
Details
This function generates a volcano plot for each combination of gene
signature (from genes) and contrast (from DEResultsList). It
uses the specified x and y statistics to plot points via
ggplot2. Non-interesting genes are plotted using
nointerestcolor, while genes in the specified gene signature (if not
"ALL") are highlighted using highlightcolor. Optionally, the top and
bottom N genes can be annotated with text labels (using
ggrepel::geom_text_repel). Threshold lines for the x and/or y axes
are added if threshold_x or threshold_y are provided. The
individual plots are arranged into a grid using ggpubr::ggarrange and
annotated with labels using ggpubr::annotate_figure and
grid::textGrob. The custom wrap_title() function is used to
wrap long labels.
Additionally, the function allows:
Plotting of differentially expressed genes based on provided statistics (e.g.,
x = "logFC"andy = "-log10(adj.P.Val)").Coloring of non-interesting genes and highlighting genes belonging to specific gene signatures.
Annotation of the top
Ngenes with text labels (usingggrepel::geom_text_repel).Addition of threshold lines for the x and/or y axes.
Examples
# (Assumes you have already created `expr`, `metadata`,
# and run `calculateDE` as shown above)
# For reference, here is the minimal workflow:
set.seed(123)
expr <- matrix(rpois(1000, lambda = 20), nrow = 100, ncol = 10)
rownames(expr) <- paste0("gene", 1:100)
colnames(expr) <- paste0("sample", 1:10)
metadata <- data.frame(
sample = colnames(expr),
Group = rep(c("A", "B"), each = 5)
)
de_res <- calculateDE(
data = expr,
metadata = metadata,
variables = "Group",
contrasts = "A-B"
)
#> Using metadata column 'sample' to match samples (data column names).
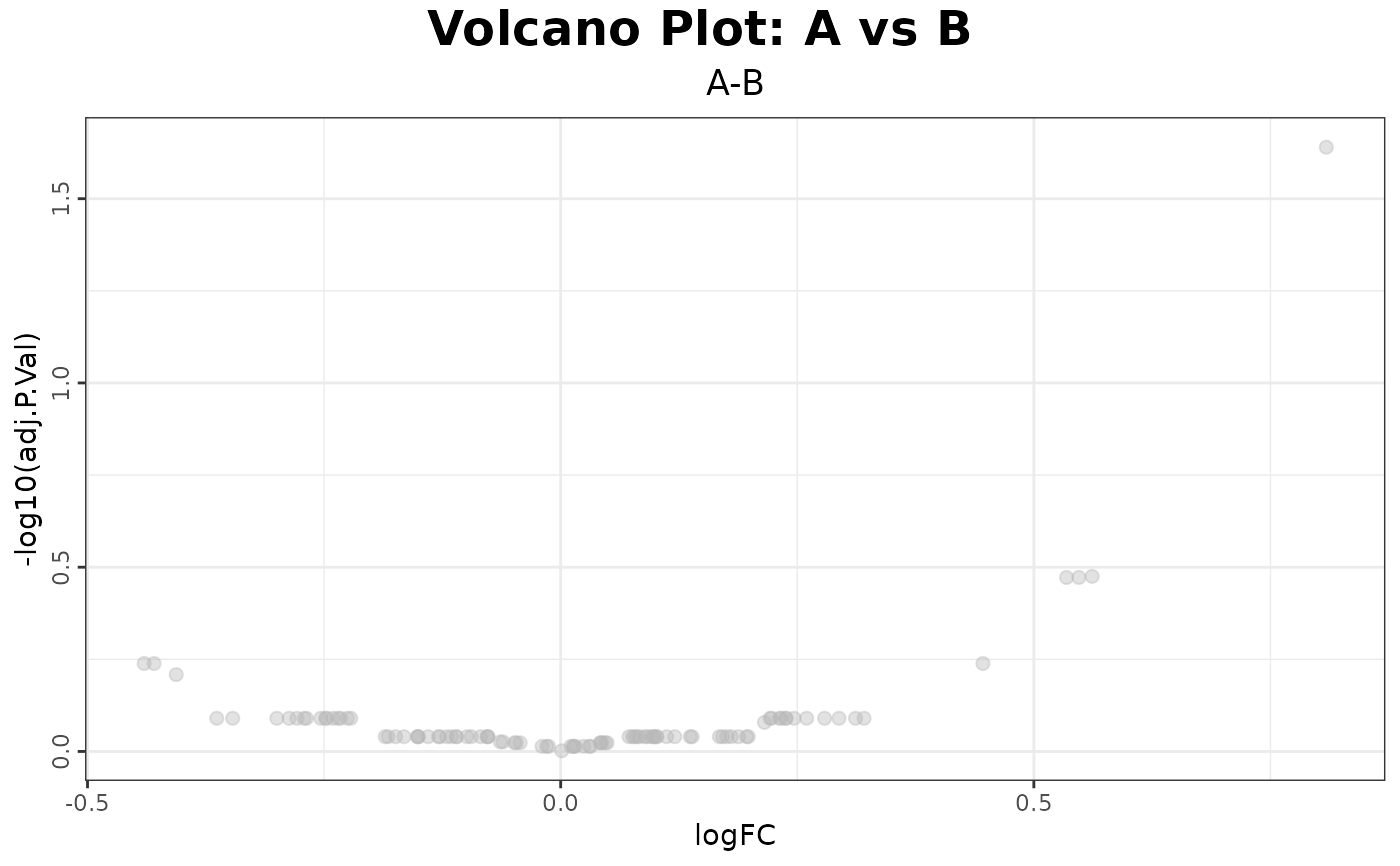
# 1. Basic volcano plot (all genes)
plotVolcano(
DEResultsList = de_res,
genes = NULL,
x = "logFC",
y = "-log10(adj.P.Val)",
pointSize = 2,
color = "#6489B4",
highlightcolor = "#05254A",
nointerestcolor = "#B7B7B7",
title = "Volcano Plot: A vs B"
)
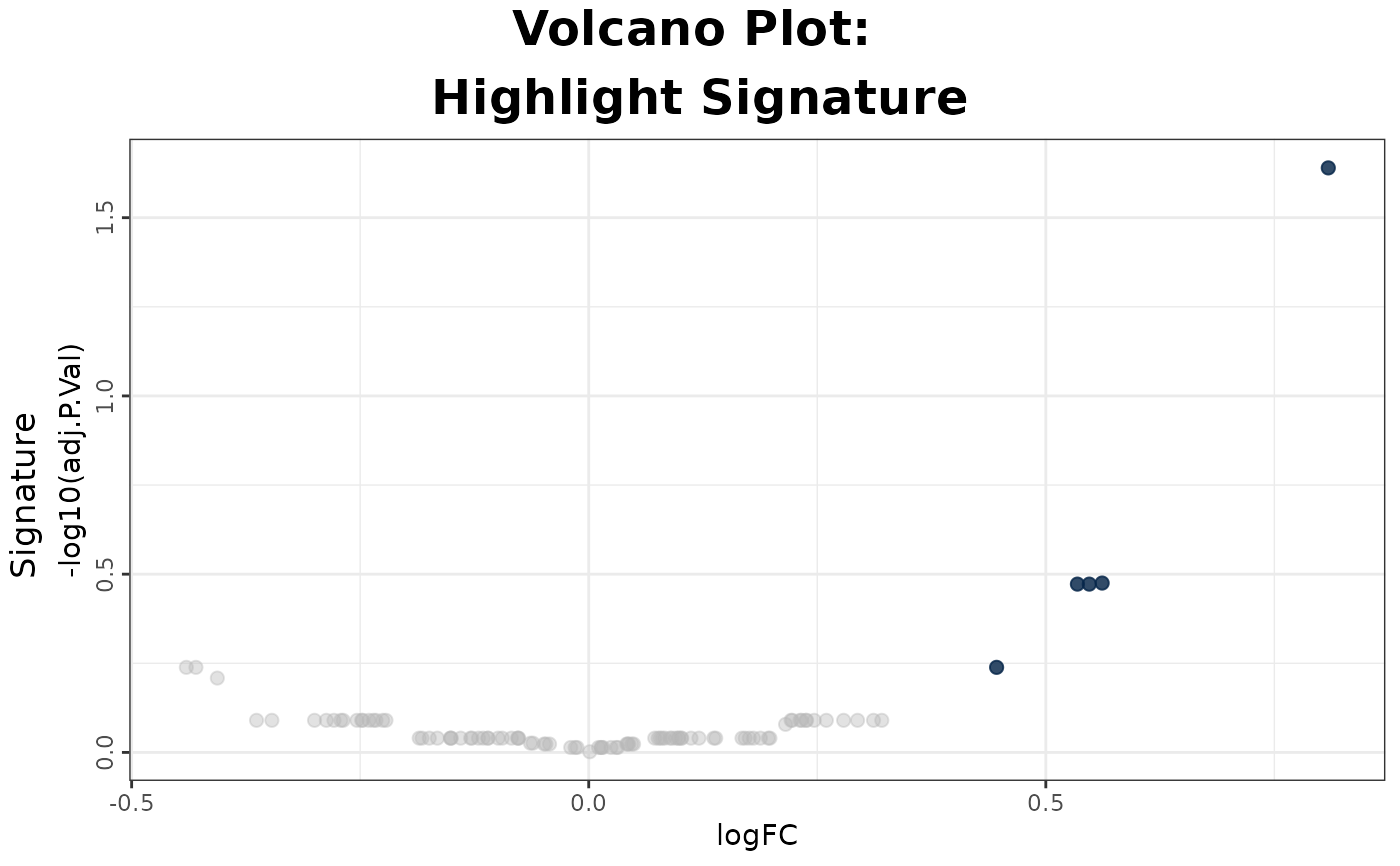
 # 2. Volcano plot highlighting a signature (e.g., top 5 upregulated genes)
sig_genes <- rownames(de_res[["A-B"]])[order(de_res[["A-B"]]$logFC,
decreasing = TRUE)[1:5]]
plotVolcano(
DEResultsList = de_res,
genes = list(Signature = sig_genes),
x = "logFC",
y = "-log10(adj.P.Val)",
pointSize = 2,
color = "#6489B4",
highlightcolor = "#05254A",
nointerestcolor = "#B7B7B7",
title = "Volcano Plot: Highlight Signature"
)
# 2. Volcano plot highlighting a signature (e.g., top 5 upregulated genes)
sig_genes <- rownames(de_res[["A-B"]])[order(de_res[["A-B"]]$logFC,
decreasing = TRUE)[1:5]]
plotVolcano(
DEResultsList = de_res,
genes = list(Signature = sig_genes),
x = "logFC",
y = "-log10(adj.P.Val)",
pointSize = 2,
color = "#6489B4",
highlightcolor = "#05254A",
nointerestcolor = "#B7B7B7",
title = "Volcano Plot: Highlight Signature"
)