Plot Signature Similarity via Jaccard Index or Fisher's Odds Ratio
Source:R/geneset_similarity.R
geneset_similarity.RdVisualizes similarity between user-defined gene signatures and either other user-defined signatures or MSigDB gene sets, using either the Jaccard index or Fisher's Odds Ratio. Produces a heatmap of pairwise similarity metrics.
Usage
geneset_similarity(
  signatures,
  other_user_signatures = NULL,
  collection = NULL,
  subcollection = NULL,
  metric = c("jaccard", "odds_ratio"),
  universe = NULL,
  or_threshold = 1,
  pval_threshold = 0.05,
  limits = NULL,
  title_size = 12,
  color = "#B44141",
  neutral_color = "white",
  cold_color = "#4173B4",
  title = NULL,
  jaccard_threshold = 0,
  msig_subset = NULL,
  width_text = 20,
  na_color = "grey90"
)
Arguments
- signatures
A named list of character vectors representing reference gene signatures.
- other_user_signatures
Optional. A named list of character vectors representing other user-defined signatures to compare against.
- collection
Optional. MSigDB collection name (e.g.,
"H"for hallmark,"C2"for curated gene sets). Use msigdbr::msigdbr_collections() for the available options.- subcollection
Optional. Subcategory within an MSigDB collection (e.g.,
"CP:REACTOME"). Use msigdbr::msigdbr_collections() for the available options.- metric
Character. Either "jaccard" or "odds_ratio".
- universe
Character vector. Background gene universe. Required for odds ratio.
- or_threshold
(only if method == "odds_ratio" only) Numeric. Minimum Odds Ratio required for a gene set to be included in the plot. Default is 1.
- pval_threshold
(only if method == "odds_ratio" only) Numeric. Maximum adjusted p-value required for a gene set to be included in the plot. Default is 0.05.
- limits
Numeric vector of length 2. Limits for color scale. If
NULL, is automatically set to c(0,1) for Jaccard or the range of OR for odds ratio.- title_size
Integer specifying the font size for the plot title. Default is
12.- color
Character. The color for the maximum of the scale. Default is
red.If
method = "jaccard", the scale goes fromneutral_colortocolor.If
method = "odds_ratio"and any OR >= 1, the scale ends atcolor.If
method = "odds_ratio"and all OR <= 1,coloris not used; instead, the scale runs fromcold_color(minimum) toneutral_color(OR = 1, if present; otherwiseneutral_coloris the maximum).
- neutral_color
Character. The neutral reference color. Default is
white.If
method = "jaccard", this is the minimum of the scale.If
method = "odds_ratio"and any OR >= 1, this corresponds to OR = 1 if such values exist; otherwise it is the minimum of the scale.If
method = "odds_ratio"and all OR <= 1, this corresponds to OR = 1 if such values exist; otherwise it is the maximum of the scale (withcold_coloras the minimum).
- cold_color
Character. The color for values below OR = 1 (only used when
method = "odds_ratio"). Default isblue.If
method = "odds_ratio"and any OR < 1, the scale runs fromcold_color(minimum) toneutral_color(OR = 1 if present; otherwiseneutral_coloris the maximum).Ignored if
method = "jaccard"or if all OR >= 1.
- title
Optional. Custom title for the plot. If
NULL, the title defaults to"Signature Overlap".- jaccard_threshold
(only if method == "jaccard" only) Numeric. Minimum Jaccard index required for a gene set to be included in the plot. Default is
0.- msig_subset
Optional. Character vector of MSigDB gene set names to subset from the specified collection. Useful to restrict analysis to a specific set of pathways. If supplied, other filters will apply only to this subset. Use "collection = "all" to mix gene sets from different collections.
- width_text
Integer. Character wrap width for labels.
- na_color
Character. Color for NA values in the heatmap. Default is
"grey90".
Value
Invisibly returns a list containing:
plotThe ggplot2 object of the similarity heatmap.
dataThe data frame object containing the similarity scores per pair of gene sets.
Examples
# Create two simple gene signatures
sig1 <- c("TP53", "BRCA1", "MYC", "EGFR", "CDK2")
sig2 <- c("ATXN2", "FUS", "MTOR", "CASP3")
signatures <- list(SignatureA = sig1, SignatureB = sig2)
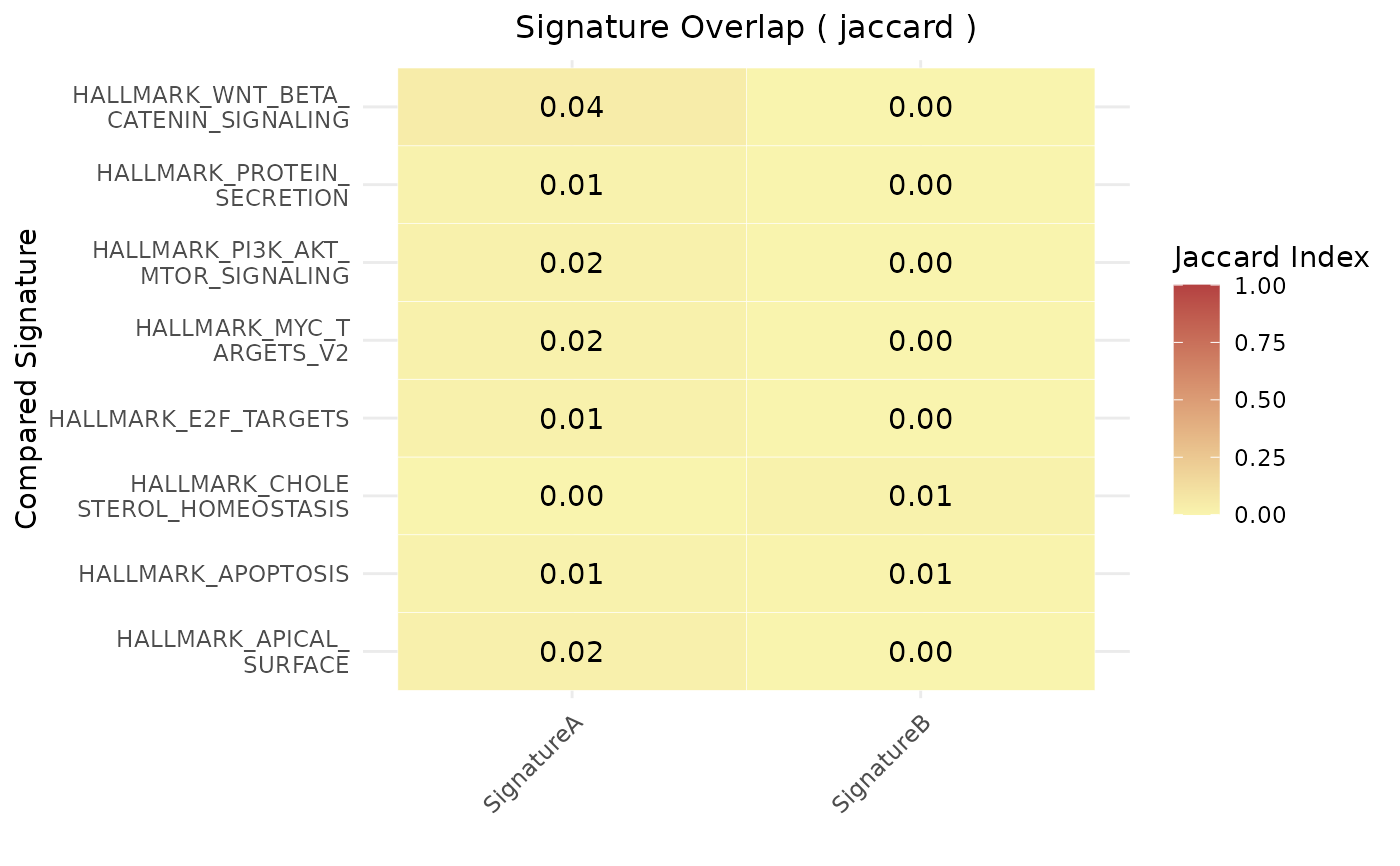
# Compare the signatures using the Jaccard index
plt <- geneset_similarity(
signatures = signatures,
metric = "jaccard",
collection = "H",
jaccard_threshold = 0.01
)
# Print the plot (will show a small heatmap)
print(plt)
#> $plot
 #>
#> $data
#> Reference_Signature Compared_Signature Score Pval
#> 6 SignatureA HALLMARK_APICAL_SURFACE 0.020833333 NA
#> 7 SignatureA HALLMARK_APOPTOSIS 0.012195122 NA
#> 9 SignatureA HALLMARK_CHOLESTEROL_HOMEOSTASIS 0.000000000 NA
#> 13 SignatureA HALLMARK_E2F_TARGETS 0.014851485 NA
#> 33 SignatureA HALLMARK_MYC_TARGETS_V2 0.016129032 NA
#> 40 SignatureA HALLMARK_PI3K_AKT_MTOR_SIGNALING 0.018518519 NA
#> 41 SignatureA HALLMARK_PROTEIN_SECRETION 0.010000000 NA
#> 49 SignatureA HALLMARK_WNT_BETA_CATENIN_SIGNALING 0.044444444 NA
#> 56 SignatureB HALLMARK_APICAL_SURFACE 0.000000000 NA
#> 57 SignatureB HALLMARK_APOPTOSIS 0.006097561 NA
#> 59 SignatureB HALLMARK_CHOLESTEROL_HOMEOSTASIS 0.012987013 NA
#> 63 SignatureB HALLMARK_E2F_TARGETS 0.000000000 NA
#> 83 SignatureB HALLMARK_MYC_TARGETS_V2 0.000000000 NA
#> 90 SignatureB HALLMARK_PI3K_AKT_MTOR_SIGNALING 0.000000000 NA
#> 91 SignatureB HALLMARK_PROTEIN_SECRETION 0.000000000 NA
#> 99 SignatureB HALLMARK_WNT_BETA_CATENIN_SIGNALING 0.000000000 NA
#>
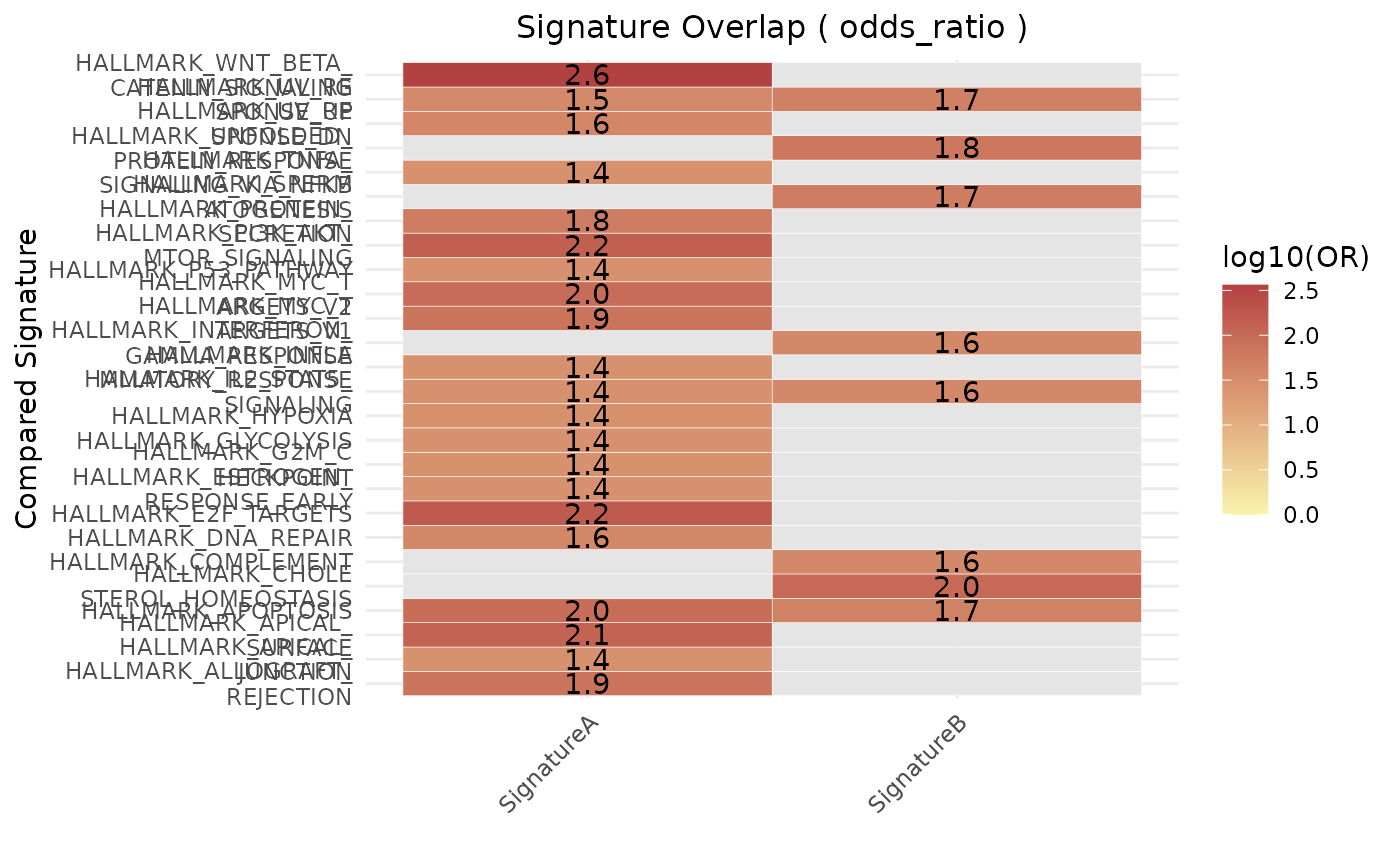
# Odds ratio example (requires universe)
gene_universe <- unique(c(
sig1, sig2,
msigdbr::msigdbr(species = "Homo sapiens", category = "C2")$gene_symbol
))
#> Warning: The `category` argument of `msigdbr()` is deprecated as of msigdbr 10.0.0.
#> ℹ Please use the `collection` argument instead.
plt_or <- geneset_similarity(
signatures = signatures,
metric = "odds_ratio",
universe = gene_universe,
collection = "H"
)
print(plt_or)
#> $plot
#>
#> $data
#> Reference_Signature Compared_Signature Score Pval
#> 6 SignatureA HALLMARK_APICAL_SURFACE 0.020833333 NA
#> 7 SignatureA HALLMARK_APOPTOSIS 0.012195122 NA
#> 9 SignatureA HALLMARK_CHOLESTEROL_HOMEOSTASIS 0.000000000 NA
#> 13 SignatureA HALLMARK_E2F_TARGETS 0.014851485 NA
#> 33 SignatureA HALLMARK_MYC_TARGETS_V2 0.016129032 NA
#> 40 SignatureA HALLMARK_PI3K_AKT_MTOR_SIGNALING 0.018518519 NA
#> 41 SignatureA HALLMARK_PROTEIN_SECRETION 0.010000000 NA
#> 49 SignatureA HALLMARK_WNT_BETA_CATENIN_SIGNALING 0.044444444 NA
#> 56 SignatureB HALLMARK_APICAL_SURFACE 0.000000000 NA
#> 57 SignatureB HALLMARK_APOPTOSIS 0.006097561 NA
#> 59 SignatureB HALLMARK_CHOLESTEROL_HOMEOSTASIS 0.012987013 NA
#> 63 SignatureB HALLMARK_E2F_TARGETS 0.000000000 NA
#> 83 SignatureB HALLMARK_MYC_TARGETS_V2 0.000000000 NA
#> 90 SignatureB HALLMARK_PI3K_AKT_MTOR_SIGNALING 0.000000000 NA
#> 91 SignatureB HALLMARK_PROTEIN_SECRETION 0.000000000 NA
#> 99 SignatureB HALLMARK_WNT_BETA_CATENIN_SIGNALING 0.000000000 NA
#>
# Odds ratio example (requires universe)
gene_universe <- unique(c(
sig1, sig2,
msigdbr::msigdbr(species = "Homo sapiens", category = "C2")$gene_symbol
))
#> Warning: The `category` argument of `msigdbr()` is deprecated as of msigdbr 10.0.0.
#> ℹ Please use the `collection` argument instead.
plt_or <- geneset_similarity(
signatures = signatures,
metric = "odds_ratio",
universe = gene_universe,
collection = "H"
)
print(plt_or)
#> $plot
 #>
#> $data
#> Reference_Signature Compared_Signature Score
#> odds ratio1 SignatureA HALLMARK_ALLOGRAFT_REJECTION 74.74599
#> odds ratio4 SignatureA HALLMARK_APICAL_JUNCTION 27.89809
#> odds ratio5 SignatureA HALLMARK_APICAL_SURFACE 129.64520
#> odds ratio6 SignatureA HALLMARK_APOPTOSIS 93.35570
#> odds ratio8 SignatureA HALLMARK_CHOLESTEROL_HOMEOSTASIS 0.00000
#> odds ratio10 SignatureA HALLMARK_COMPLEMENT 0.00000
#> odds ratio11 SignatureA HALLMARK_DNA_REPAIR 37.36258
#> odds ratio12 SignatureA HALLMARK_E2F_TARGETS 168.75474
#> odds ratio14 SignatureA HALLMARK_ESTROGEN_RESPONSE_EARLY 27.89809
#> odds ratio17 SignatureA HALLMARK_G2M_CHECKPOINT 27.89809
#> odds ratio18 SignatureA HALLMARK_GLYCOLYSIS 27.89809
#> odds ratio21 SignatureA HALLMARK_HYPOXIA 27.89809
#> odds ratio22 SignatureA HALLMARK_IL2_STAT5_SIGNALING 28.03986
#> odds ratio24 SignatureA HALLMARK_INFLAMMATORY_RESPONSE 27.89809
#> odds ratio26 SignatureA HALLMARK_INTERFERON_GAMMA_RESPONSE 0.00000
#> odds ratio31 SignatureA HALLMARK_MYC_TARGETS_V1 74.74599
#> odds ratio32 SignatureA HALLMARK_MYC_TARGETS_V2 97.94291
#> odds ratio36 SignatureA HALLMARK_P53_PATHWAY 27.89809
#> odds ratio39 SignatureA HALLMARK_PI3K_AKT_MTOR_SIGNALING 144.41670
#> odds ratio40 SignatureA HALLMARK_PROTEIN_SECRETION 58.70219
#> odds ratio42 SignatureA HALLMARK_SPERMATOGENESIS 0.00000
#> odds ratio44 SignatureA HALLMARK_TNFA_SIGNALING_VIA_NFKB 27.89809
#> odds ratio45 SignatureA HALLMARK_UNFOLDED_PROTEIN_RESPONSE 0.00000
#> odds ratio46 SignatureA HALLMARK_UV_RESPONSE_DN 38.91798
#> odds ratio47 SignatureA HALLMARK_UV_RESPONSE_UP 35.43974
#> odds ratio48 SignatureA HALLMARK_WNT_BETA_CATENIN_SIGNALING 368.06888
#> odds ratio51 SignatureB HALLMARK_ALLOGRAFT_REJECTION 0.00000
#> odds ratio54 SignatureB HALLMARK_APICAL_JUNCTION 0.00000
#> odds ratio55 SignatureB HALLMARK_APICAL_SURFACE 0.00000
#> odds ratio56 SignatureB HALLMARK_APOPTOSIS 46.33853
#> odds ratio58 SignatureB HALLMARK_CHOLESTEROL_HOMEOSTASIS 101.83286
#> odds ratio60 SignatureB HALLMARK_COMPLEMENT 37.21197
#> odds ratio61 SignatureB HALLMARK_DNA_REPAIR 0.00000
#> odds ratio62 SignatureB HALLMARK_E2F_TARGETS 0.00000
#> odds ratio64 SignatureB HALLMARK_ESTROGEN_RESPONSE_EARLY 0.00000
#> odds ratio67 SignatureB HALLMARK_G2M_CHECKPOINT 0.00000
#> odds ratio68 SignatureB HALLMARK_GLYCOLYSIS 0.00000
#> odds ratio71 SignatureB HALLMARK_HYPOXIA 0.00000
#> odds ratio72 SignatureB HALLMARK_IL2_STAT5_SIGNALING 37.40123
#> odds ratio74 SignatureB HALLMARK_INFLAMMATORY_RESPONSE 0.00000
#> odds ratio76 SignatureB HALLMARK_INTERFERON_GAMMA_RESPONSE 37.21197
#> odds ratio81 SignatureB HALLMARK_MYC_TARGETS_V1 0.00000
#> odds ratio82 SignatureB HALLMARK_MYC_TARGETS_V2 0.00000
#> odds ratio86 SignatureB HALLMARK_P53_PATHWAY 0.00000
#> odds ratio89 SignatureB HALLMARK_PI3K_AKT_MTOR_SIGNALING 0.00000
#> odds ratio90 SignatureB HALLMARK_PROTEIN_SECRETION 0.00000
#> odds ratio92 SignatureB HALLMARK_SPERMATOGENESIS 55.36740
#> odds ratio94 SignatureB HALLMARK_TNFA_SIGNALING_VIA_NFKB 0.00000
#> odds ratio95 SignatureB HALLMARK_UNFOLDED_PROTEIN_RESPONSE 66.32153
#> odds ratio96 SignatureB HALLMARK_UV_RESPONSE_DN 0.00000
#> odds ratio97 SignatureB HALLMARK_UV_RESPONSE_UP 47.21961
#> odds ratio98 SignatureB HALLMARK_WNT_BETA_CATENIN_SIGNALING 0.00000
#> Pval
#> odds ratio1 7.762168e-04
#> odds ratio4 4.377023e-02
#> odds ratio5 9.764250e-03
#> odds ratio6 5.041517e-04
#> odds ratio8 1.000000e+00
#> odds ratio10 1.000000e+00
#> odds ratio11 3.297426e-02
#> odds ratio12 6.878778e-06
#> odds ratio14 4.377023e-02
#> odds ratio17 4.377023e-02
#> odds ratio18 4.377023e-02
#> odds ratio21 4.377023e-02
#> odds ratio22 4.355526e-02
#> odds ratio24 4.377023e-02
#> odds ratio26 1.000000e+00
#> odds ratio31 7.762168e-04
#> odds ratio32 1.285501e-02
#> odds ratio36 4.377023e-02
#> odds ratio39 2.147889e-04
#> odds ratio40 2.120533e-02
#> odds ratio42 1.000000e+00
#> odds ratio44 4.377023e-02
#> odds ratio45 1.000000e+00
#> odds ratio46 3.167222e-02
#> odds ratio47 3.470814e-02
#> odds ratio48 3.406155e-05
#> odds ratio51 1.000000e+00
#> odds ratio54 1.000000e+00
#> odds ratio55 1.000000e+00
#> odds ratio56 2.838699e-02
#> odds ratio58 1.312359e-02
#> odds ratio60 3.517142e-02
#> odds ratio61 1.000000e+00
#> odds ratio62 1.000000e+00
#> odds ratio64 1.000000e+00
#> odds ratio67 1.000000e+00
#> odds ratio68 1.000000e+00
#> odds ratio71 1.000000e+00
#> odds ratio72 3.499791e-02
#> odds ratio74 1.000000e+00
#> odds ratio76 3.517142e-02
#> odds ratio81 1.000000e+00
#> odds ratio82 1.000000e+00
#> odds ratio86 1.000000e+00
#> odds ratio89 1.000000e+00
#> odds ratio90 1.000000e+00
#> odds ratio92 2.384420e-02
#> odds ratio94 1.000000e+00
#> odds ratio95 1.998787e-02
#> odds ratio96 1.000000e+00
#> odds ratio97 2.786363e-02
#> odds ratio98 1.000000e+00
#>
#>
#> $data
#> Reference_Signature Compared_Signature Score
#> odds ratio1 SignatureA HALLMARK_ALLOGRAFT_REJECTION 74.74599
#> odds ratio4 SignatureA HALLMARK_APICAL_JUNCTION 27.89809
#> odds ratio5 SignatureA HALLMARK_APICAL_SURFACE 129.64520
#> odds ratio6 SignatureA HALLMARK_APOPTOSIS 93.35570
#> odds ratio8 SignatureA HALLMARK_CHOLESTEROL_HOMEOSTASIS 0.00000
#> odds ratio10 SignatureA HALLMARK_COMPLEMENT 0.00000
#> odds ratio11 SignatureA HALLMARK_DNA_REPAIR 37.36258
#> odds ratio12 SignatureA HALLMARK_E2F_TARGETS 168.75474
#> odds ratio14 SignatureA HALLMARK_ESTROGEN_RESPONSE_EARLY 27.89809
#> odds ratio17 SignatureA HALLMARK_G2M_CHECKPOINT 27.89809
#> odds ratio18 SignatureA HALLMARK_GLYCOLYSIS 27.89809
#> odds ratio21 SignatureA HALLMARK_HYPOXIA 27.89809
#> odds ratio22 SignatureA HALLMARK_IL2_STAT5_SIGNALING 28.03986
#> odds ratio24 SignatureA HALLMARK_INFLAMMATORY_RESPONSE 27.89809
#> odds ratio26 SignatureA HALLMARK_INTERFERON_GAMMA_RESPONSE 0.00000
#> odds ratio31 SignatureA HALLMARK_MYC_TARGETS_V1 74.74599
#> odds ratio32 SignatureA HALLMARK_MYC_TARGETS_V2 97.94291
#> odds ratio36 SignatureA HALLMARK_P53_PATHWAY 27.89809
#> odds ratio39 SignatureA HALLMARK_PI3K_AKT_MTOR_SIGNALING 144.41670
#> odds ratio40 SignatureA HALLMARK_PROTEIN_SECRETION 58.70219
#> odds ratio42 SignatureA HALLMARK_SPERMATOGENESIS 0.00000
#> odds ratio44 SignatureA HALLMARK_TNFA_SIGNALING_VIA_NFKB 27.89809
#> odds ratio45 SignatureA HALLMARK_UNFOLDED_PROTEIN_RESPONSE 0.00000
#> odds ratio46 SignatureA HALLMARK_UV_RESPONSE_DN 38.91798
#> odds ratio47 SignatureA HALLMARK_UV_RESPONSE_UP 35.43974
#> odds ratio48 SignatureA HALLMARK_WNT_BETA_CATENIN_SIGNALING 368.06888
#> odds ratio51 SignatureB HALLMARK_ALLOGRAFT_REJECTION 0.00000
#> odds ratio54 SignatureB HALLMARK_APICAL_JUNCTION 0.00000
#> odds ratio55 SignatureB HALLMARK_APICAL_SURFACE 0.00000
#> odds ratio56 SignatureB HALLMARK_APOPTOSIS 46.33853
#> odds ratio58 SignatureB HALLMARK_CHOLESTEROL_HOMEOSTASIS 101.83286
#> odds ratio60 SignatureB HALLMARK_COMPLEMENT 37.21197
#> odds ratio61 SignatureB HALLMARK_DNA_REPAIR 0.00000
#> odds ratio62 SignatureB HALLMARK_E2F_TARGETS 0.00000
#> odds ratio64 SignatureB HALLMARK_ESTROGEN_RESPONSE_EARLY 0.00000
#> odds ratio67 SignatureB HALLMARK_G2M_CHECKPOINT 0.00000
#> odds ratio68 SignatureB HALLMARK_GLYCOLYSIS 0.00000
#> odds ratio71 SignatureB HALLMARK_HYPOXIA 0.00000
#> odds ratio72 SignatureB HALLMARK_IL2_STAT5_SIGNALING 37.40123
#> odds ratio74 SignatureB HALLMARK_INFLAMMATORY_RESPONSE 0.00000
#> odds ratio76 SignatureB HALLMARK_INTERFERON_GAMMA_RESPONSE 37.21197
#> odds ratio81 SignatureB HALLMARK_MYC_TARGETS_V1 0.00000
#> odds ratio82 SignatureB HALLMARK_MYC_TARGETS_V2 0.00000
#> odds ratio86 SignatureB HALLMARK_P53_PATHWAY 0.00000
#> odds ratio89 SignatureB HALLMARK_PI3K_AKT_MTOR_SIGNALING 0.00000
#> odds ratio90 SignatureB HALLMARK_PROTEIN_SECRETION 0.00000
#> odds ratio92 SignatureB HALLMARK_SPERMATOGENESIS 55.36740
#> odds ratio94 SignatureB HALLMARK_TNFA_SIGNALING_VIA_NFKB 0.00000
#> odds ratio95 SignatureB HALLMARK_UNFOLDED_PROTEIN_RESPONSE 66.32153
#> odds ratio96 SignatureB HALLMARK_UV_RESPONSE_DN 0.00000
#> odds ratio97 SignatureB HALLMARK_UV_RESPONSE_UP 47.21961
#> odds ratio98 SignatureB HALLMARK_WNT_BETA_CATENIN_SIGNALING 0.00000
#> Pval
#> odds ratio1 7.762168e-04
#> odds ratio4 4.377023e-02
#> odds ratio5 9.764250e-03
#> odds ratio6 5.041517e-04
#> odds ratio8 1.000000e+00
#> odds ratio10 1.000000e+00
#> odds ratio11 3.297426e-02
#> odds ratio12 6.878778e-06
#> odds ratio14 4.377023e-02
#> odds ratio17 4.377023e-02
#> odds ratio18 4.377023e-02
#> odds ratio21 4.377023e-02
#> odds ratio22 4.355526e-02
#> odds ratio24 4.377023e-02
#> odds ratio26 1.000000e+00
#> odds ratio31 7.762168e-04
#> odds ratio32 1.285501e-02
#> odds ratio36 4.377023e-02
#> odds ratio39 2.147889e-04
#> odds ratio40 2.120533e-02
#> odds ratio42 1.000000e+00
#> odds ratio44 4.377023e-02
#> odds ratio45 1.000000e+00
#> odds ratio46 3.167222e-02
#> odds ratio47 3.470814e-02
#> odds ratio48 3.406155e-05
#> odds ratio51 1.000000e+00
#> odds ratio54 1.000000e+00
#> odds ratio55 1.000000e+00
#> odds ratio56 2.838699e-02
#> odds ratio58 1.312359e-02
#> odds ratio60 3.517142e-02
#> odds ratio61 1.000000e+00
#> odds ratio62 1.000000e+00
#> odds ratio64 1.000000e+00
#> odds ratio67 1.000000e+00
#> odds ratio68 1.000000e+00
#> odds ratio71 1.000000e+00
#> odds ratio72 3.499791e-02
#> odds ratio74 1.000000e+00
#> odds ratio76 3.517142e-02
#> odds ratio81 1.000000e+00
#> odds ratio82 1.000000e+00
#> odds ratio86 1.000000e+00
#> odds ratio89 1.000000e+00
#> odds ratio90 1.000000e+00
#> odds ratio92 2.384420e-02
#> odds ratio94 1.000000e+00
#> odds ratio95 1.998787e-02
#> odds ratio96 1.000000e+00
#> odds ratio97 2.786363e-02
#> odds ratio98 1.000000e+00
#>